Download presentation
Presentation is loading. Please wait.

1
Mass Spectrometry A.) Introduction:
Mass Spectrometry (MS) measures the atomic or molecular weight of a ion from the separation based on its mass to charge ratio (m/z) - elemental composition of matter - structures of inorganic, organic and biological molecules - qualitative and quantitative composition of complex mixtures - isotopic ratios of atoms in the sample One of the MOST Routinely used Analytical Techniques
 measures the atomic or molecular weight of a ion from the separation based on its mass to charge ratio (m/z) - elemental composition of matter. - structures of inorganic, organic and biological molecules. - qualitative and quantitative composition of complex mixtures. - isotopic ratios of atoms in the sample. One of the MOST Routinely used Analytical Techniques.")
2
Mass Spectrometry Nobel Laureates: Joseph John Thomson
Physics 1906 first mass spectrometer Francis William Aston Chemistry 1922 mass spectrometry of isotopes John B. Fenn Chemistry 2002 electrospray ionization of biomolecules Wolfgang Paul Physics 1989 quadrupole and quadrupole ion trap MS Koichi Tanaka Chemistry 2002 Matrix-assisted laser Desoprtion/ionization (MALDI) A Long and Continuing History of Achievements
 A Long and Continuing History of Achievements.")
3
Mass Spectrometry Mass Spectrometry Data Quantitative Information
Qualitative Analysis Molecular Weight Determination Structure Determination Quantitative Analysis Biotechnology analysis of proteins & peptides analysis of oligonucleotides Pharmaceutical drug discovery, combinatorial chemistry pharmokinetics, drug metabolism Clinical neonatal screening, hemoglobin analysis drug testing Environmental water, food, air quality (PCDs etcs) Geological oil composition Toxicology Forensics Abundance Qualitative Information Quantitative Information
 Geological. oil composition. Toxicology. Forensics. Abundance. Qualitative Information. Quantitative Information.")
4
Mass Spectrometry Disadvantages
Advantages Over Atomic Optical Spectrometric Detection limits three orders of magnitude better Remarkably simple spectra that are unique and easily interpreted Ability to measure isotopic ratios Disadvantages Instrument costs are two to three times higher Instrument drift that can be as high as 5- 10% per hour Interference effects

5
Discriminates among the masses of isotopes
Atomic Weights in MS Discriminates among the masses of isotopes differs from other analytical techniques Atomic mass units (amu) or daltons (Da) Relative scale: exactly 12 amu amu or Da equals 1/12 mass of x10-24 g/atom All measured masses relative to has a mass times Da x = Da atomic weight = g/mol Exact Mass (m) Sum of specific set of isotopes within compounds 12C1H4: m = x x 4 = Da 13C1H4: m = x x 4 = Da 12C1H32H1: m = x x x 1 = Da 3-4 significant figures to right of decimal Nominal Mass (m) Whole number precision in mass measurement 12C1H4: m = 12 x x 4 = 16 Da 13C1H4: m = 13 x x 4 = 17 Da 12C1H32H1: m = 12 x x x 1 = 17 Da
 or daltons (Da) Relative scale: exactly 12 amu. amu or Da equals 1/12 mass of x10-24 g/atom. All measured masses relative to. has a mass times Da x = Da atomic weight = g/mol. Exact Mass (m) Sum of specific set of isotopes within compounds. 12C1H4: m = x x 4 = Da. 13C1H4: m = x x 4 = Da. 12C1H32H1: m = x x x 1 = Da. 3-4 significant figures to right of decimal. Nominal Mass (m) Whole number precision in mass measurement. 12C1H4: m = 12 x x 4 = 16 Da. 13C1H4: m = 13 x x 4 = 17 Da. 12C1H32H1: m = 12 x x x 1 = 17 Da.")
6
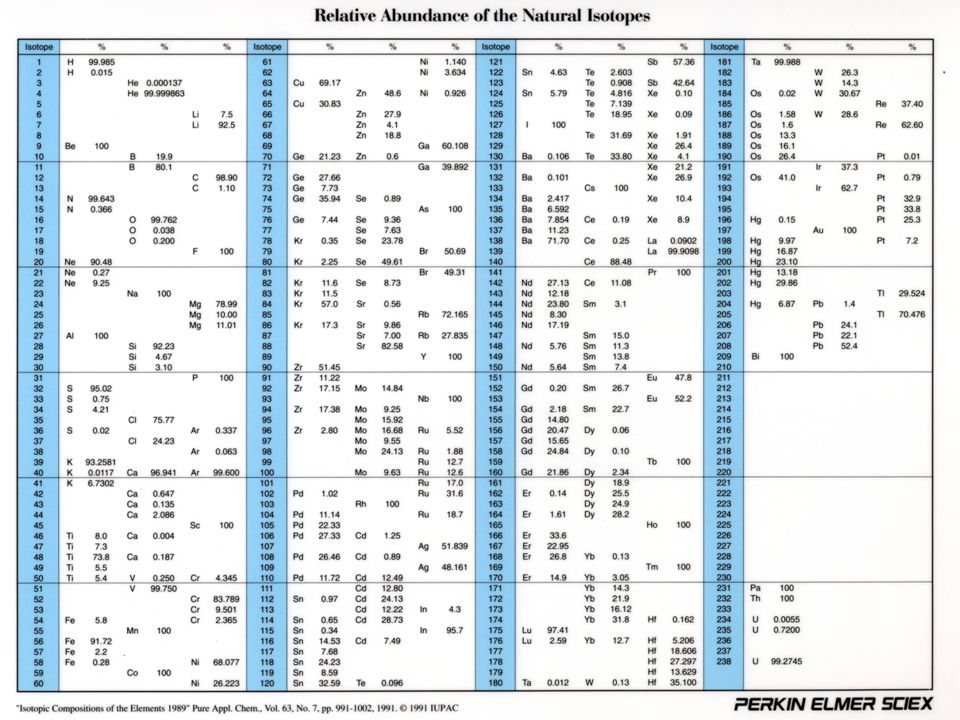
Chemical atomic weight or average atomic weight
Atomic Weights in MS Chemical atomic weight or average atomic weight A1, A2, An :atomic masses in Da p1, p2, pn :fractional abundance of each isotope n :number of isotopes Weight of interest for most purposes Sum of chemical atomic weights for the atoms in the compound formula CH4 (m) = x = Da typical atomic masses in periodic table Boron: 10B 23% 11B 100% B (m) = (23x x11)/123 = 10.81 Zirconium: 90Zr 51.5% 91Zr 11.2% 92Zr 17.1 % 94Zr 17.4% 96Zr 2.8% Zr (m) = (51.5x x x x96)/100 =
 = x = Da. typical atomic masses in periodic table. Boron: 10B 23% 11B 100% B (m) = (23x x11)/123. = Zirconium: 90Zr 51.5% 91Zr 11.2% 92Zr 17.1 % 94Zr 17.4% 96Zr 2.8% Zr (m) = (51.5x x x x96)/100. =")
8
Molecular Formulas from Exact Molecular Weights
Requires identification of molecular ion peak Exact mass needs to be determined High resolution instruments detect mass differences of a few thousands of amu Purine, C5H4N4 (m = ) Benzamidine, C7H8N2 (m = ) Ethyltolune, C9H12 (m = ) Acetophenone, C8H8O (m = ) Molecular ion peak is ± only C7H8N2 is possible formula Precision of a few parts per million is routinely possible
 Benzamidine, C7H8N2 (m = ) Ethyltolune, C9H12 (m = ) Acetophenone, C8H8O (m = ) Molecular ion peak is ± only C7H8N2 is possible formula. Precision of a few parts per million is routinely possible.")
9
Molecular Formulas from Isotopic Ratios
Low-resolution instrument only differentiate whole number masses Requires sufficiently intense molecular ion peak Requires accurate heights for (M+1)+ and (M+2)+ C6H4N2O4 13C 6 x = 6.48 2H 4 x = 0.060% 15N 2 x = 0.74% 17O 4 x = 0.16% (M+1)+/M+ = 7.44% C12H24 13C 12 x = 12.96% 2H 24 x = % (M+1)+/M+ = 13.32%
+ and (M+2)+ C6H4N2O4. 13C. 6 x 1.08 = H. 4 x = 0.060% 15N. 2 x 0.37 = 0.74% 17O. 4 x 0.04 = 0.16% (M+1)+/M+ = 7.44% C12H24. 13C. 12 x 1.08 = 12.96% 2H. 24 x = 0.36% (M+1)+/M+ = 13.32%")
10
differentiate between masses R = m/Dm or
Resolution in MS (R) differentiate between masses R = m/Dm or Higher the number the better the resolution 500,000 is better than 500 Resolution of 4000 would resolve peaks occurring at m/z values of: 400.0 and 400.1 40.00 and 40.01
 differentiate between masses. R = m/Dm. or. Higher the number the better the resolution. 500,000 is better than 500. Resolution of 4000 would resolve peaks occurring at m/z values of: and and")
11
Example 22: Calculate the resolution to differentiate (a) C2H4+ (m = ) and CH2N+ (m = ) and (b) N2+ (m = ) and CO+ (m = ).
 C2H4+ (m = ) and CH2N+ (m = ) and (b) N2+ (m = ) and CO+ (m = ).")
12
Identification of odd electron ions – The Nitrogen Rule
Based on an anomaly in the relationship between the atomic weights and valences of the common elements An organic molecule containing the elements C, H, O, S, P or halogen odd nominal mass if it contains an odd number of nitrogen atoms even nominal mass if it contains an even number of nitrogen atoms (including 0) Element At Wt Valence H 1 C 12 4 N 14 3 O 16 2 F 19 S 32 Cl 35/37 Compound MW CO2 44 CO 28 CH4 16 HCO2H 46 HCl 36/38 HCN 27 N2 NH3 17 Even nominal mass even valence Odd nominal mass odd valence Nitrogen is the exception
 Element. At Wt. Valence. H. 1. C N O F. 19. S. 32. Cl. 35/37. Compound. MW. CO CO. 28. CH HCO2H. 46. HCl. 36/38. HCN. 27. N2. NH Even nominal mass even valence. Odd nominal mass odd valence. Nitrogen is the exception.")
13
Double Bond Equivalent (D)
number of rings or double bonds that an ion contains Calculated from the elemental formula as follows: where: D is unsaturation imax is the total number of different elements Ni the number of atoms of element i and Vi the valence of atom i valence of 1 (H, F, Cl), valence of 2 (O, S). valence of 3 (N, P), valence of 4 (C, Si). Hexane: C6H14 Mass of molecular ion: 86 D = 1+1/2((6x(4-2) + 14x(1-2)) = 0 Hexene: C6H12 Mass of molecular ion: 84 D = 1+1/2((6x(4-2) + 12x(1-2)) = 1
, valence of 2 (O, S). valence of 3 (N, P), valence of 4 (C, Si). Hexane: C6H14. Mass of molecular ion: 86. D = 1+1/2((6x(4-2) + 14x(1-2)) = 0. Hexene: C6H12. Mass of molecular ion: 84. D = 1+1/2((6x(4-2) + 12x(1-2)) = 1.")
14
Basic MS Instrument Design
Atomic Mass Spectrometry involves the following steps: atomization conversion of atoms to ions most ions are single charge separation of ions based on mass-to-charge ratio (m/z) Counting the number of ions of each type or measuring the ion current Principal Components Vacuum system maintain low pressure(10-5 to 10-8 torr) Inlet: introduce m-amount of sample into ion source Ion source: sample converted into gaseous ion by bombardment with: Electrons Photons Ions Molecules Thermal/electric energy Positive/negative ions accelerated into mass analyzer Mass analyzer: disperse ions (m/z) Transducer: convert beam of ions to electrical signal
 Counting the number of ions of each type or measuring the ion current. Principal Components. Vacuum system maintain low pressure(10-5 to 10-8 torr) Inlet: introduce m-amount of sample into ion source. Ion source: sample converted into gaseous ion by bombardment with: Electrons. Photons. Ions. Molecules. Thermal/electric energy. Positive/negative ions accelerated. into mass analyzer. Mass analyzer: disperse ions (m/z) Transducer: convert beam of ions to. electrical signal.")
15
Types of Atomic and Molecular MS
Thermal ionization & Spark source first MS Inductively coupled plasma (ICP) current common approach Differ by types ion sources and mass analyzer
 current common approach. Differ by types ion sources and mass analyzer.")
16
F = e(E+ v x B) (Lorentz force law) where:
MS Theory: 1.) Mass analyzers use electric and magnetic fields to apply a force on charged particles F = ma (Newton's second law) F = e(E+ v x B) (Lorentz force law) where: F - force applied to the ion m - mass of the ion a - acceleration e - ionic charge v x B - vector cross product E - electric field of the ion velocity and the applied magnetic field 2.) Force is therefore dependent on both mass and charge - spectrometers separate ions according to their mass-to-charge ratio (m/z) - not by mass alone
 Mass analyzers use electric and magnetic fields to apply a force on charged particles. F = ma (Newton s second law) F = e(E+ v x B) (Lorentz force law) where: F - force applied to the ion m - mass of the ion. a - acceleration e - ionic charge. v x B - vector cross product E - electric field. of the ion velocity and the applied. magnetic field. 2.) Force is therefore dependent on both mass and charge. - spectrometers separate ions according to their mass-to-charge ratio (m/z) - not by mass alone.")
17
Inlet Systems: Introduce sample into ion source with minimum loss of vacuum Spectrometer equipped with multiple inlets for different sample types Batch Inlet Direct Probe Inlet Gas Chromatography Liquid Chromatography

18
Inlet Systems: External (Batch) Inlet Systems: Simplest
Gas & liquid samples (bp < 500oC) Sample heated (<400 °C) in small external oven Sample pressure 10-4 to 10-5 torr Vapor admitted to ionizer through valve Gas stream added to analyte
 Sample heated (<400 °C) in small external oven. Sample pressure 10-4 to 10-5 torr. Vapor admitted to ionizer through valve. Gas stream added to analyte.")
19
Direct probe inlet system for solids
Inlet Systems: Direct probe inlet system for solids Probe moves through various lock system stages permits for a step-wise increase in the vacuum The direct probe is only ¼" in diameter. Direct Probe Solids and non-volatile samples Less sample is required & wasted (few ng) sample held on the surface of glass or aluminum capillary tube, fine wire or small cup Sample vial inserted through air-lock into ionizer chamber Lock system minimizes amount of air that must be pumped from system Vial heated to vaporize sample Vial can be reduced to capillary or surface plate for small quantities
 sample held on the surface of glass or aluminum capillary tube, fine wire or small cup. Sample vial inserted through air-lock into ionizer chamber. Lock system minimizes amount of air that must be pumped from system. Vial heated to vaporize sample. Vial can be reduced to capillary or surface plate for small quantities.")
20
Inlet Systems: LC & GC coupled to mass spectrometer
Permits separation and determination of components for complex mixtures Requires specialized inlet systems Major interface problem – carrier gas dilution Jet separator (separates analyte from carrier gas) Lighter carrier gas deflected by volume Heavier sample travels in straight line
 Lighter carrier gas deflected by volume. Heavier sample travels in straight line.")
21
Ion Sources: Formation of gaseous analyte ions
Mass spectrometric methods are dictated by ionization techniques Appearance of spectrum highly dependant on ionization technique Gas-phase Sample first vaporized then ionized Thermally stable compounds boiling points < 500oC MW < 100 amu Desorption Solid or liquid directly converted to gaseous ion MW as large as 105 daltons Type Name and Acronym Ionizing Process Gas Phase Electron Impact (EI) Exposure to electron stream Chemical Ionization (CI) Reagent gaseous ions Field Ionization (FI) High potential electrode Desorption Field Desorption (FD) Electrospray Ionization (ESI) High electric field Matrix-assisted desorption ionization (MALDI) Laser beam Plasma Desorption (PD) Fission fragments from 252Cf Fast Atom Bombardment (FAB) Energetic atomic beam Secondary Ion Mass Spectrometry (SIMS) Energetic beam of ions Thermospray Ionization (TS)
 Exposure to electron stream. Chemical Ionization (CI) Reagent gaseous ions. Field Ionization (FI) High potential electrode. Desorption. Field Desorption (FD) Electrospray Ionization (ESI) High electric field. Matrix-assisted desorption ionization (MALDI) Laser beam. Plasma Desorption (PD) Fission fragments from 252Cf. Fast Atom Bombardment (FAB) Energetic atomic beam. Secondary Ion Mass Spectrometry (SIMS) Energetic beam of ions. Thermospray Ionization (TS)")
22
Ion Sources: Hard sources Hard Ionization
Sufficient energy so analyte are in highly excited energy state Relaxation involves rupture of bonds Produces fragment ions with m/z < molecular ion Kinds of functional groups structural information Hard Ionization

23
Ion Sources: Soft Ionization Soft sources Cause little fragmentation
Mass spectrum consists of molecular ion and only few, if any, other peaks Accurate mass Soft Ionization

24
M + e- M●+ + 2e- Ion Sources: Electron-Impact Source (EI)
Sample heated to produce molecular vapor Bombard with a beam of electrons Electrons emitted from heated tungsten or rhenium filament Electrons accelerated by a potential of 70V Path of electrons and molecular ion at right angles Form positive ions electron beam expels electron due to electrostatic repulsion M + e- M●+ + 2e- Not very efficient one molecule in a million ionized Positive ions attracted to first slit by small potential 5V High potential applied at accelerator plates 103 to 104 V Generates molecular ion velocity

25
Ion Sources: Electron-Impact Source (EI)
Hard source 50V higher energy than chemical bond Highly excited vibrational and rotational state Electron beam does not increase translational energy Relaxation results in extensive fragmentation Large number of positive ions of various masses Typically less mass than molecular ion Lower mass ions called daughter ions Sometimes molecular ion not present

26
Ion Sources: Electron-Impact Source (EI) Base peak most intense peak
Usually a daughter ion or fragment ion Peaks at MW greater than molecular ion Same chemical formula but different isotope composition Size of peak depends on relative natural abundance of isotopes Collision Product peak (M+1)+ Collision transfers a hydrogen atom to the ion to generate a protonated molecule Second order reaction depends on concentration Increases with increase in pressure
+ Collision transfers a hydrogen atom to the ion to generate a protonated molecule. Second order reaction depends on concentration. Increases with increase in pressure.")
27
Ion Sources: Electron-Impact Source (EI) Advantages Disadvantages
Good sensitivity Fragmentation unambiguous identification of analytes Disadvantages Need to volatize sample thermal decomposition before ionization Fragmentation disappearance of molecular ion peak MW not determined

28
Ion Sources: Chemical Ionization Source (CI)
Electron Impact and Chemical Ionization are Interchangeable in a Spectrometer Chemical Ionization is the second most common procedure for generating ions Gaseous atoms from the sample are: Heated from a probe Collide with ions produced reagent gas bombarded by electrons Usually positive ions are used Need to modify electron beam Add vacuum pump capacity Reduce width of slit for mass analyzer Allow a reagent pressure of 1 torr in ionization area Keep pressure below 10-5 torr in analyzer Concentration ratio of reagent to sample is 103 to 104 Electron beam preferentially interacts with reagent instead of sample

29
Ion Sources: Hard EI Ionization Soft CI Ionization
Chemical Ionization Source (CI) Soft Source Methane is common reagent Also use propane, isobutane and ammonia Reacts with high-energy electron beam to generate several ions CH4+, CH3+ (~90% of product) and CH2+ React with other methane molecules CH4+ + CH4 CH5+ + CH3 CH3+ + CH4 C2H5+ + H2 Collisions Between sample molecule and CH5+ & C2H5+ are highly reactive Involve proton or hydride transfer CH5+ + MH MH2+ + CH4 proton transfer C2H5+ + MH MH2+ + C2H4 proton transfer C2H5+ + MH M+ +C2H6 hydride transfer Proton transfer (M + 1)+ Hydride transfer (M – 1)+ C2H5+ transfer (M + 29)+ CI Soft Ionization EI Hard Ionization
 Soft Source. Methane is common reagent. Also use propane, isobutane and ammonia. Reacts with high-energy electron beam to generate several ions. CH4+, CH3+ (~90% of product) and CH2+ React with other methane molecules. CH4+ + CH4 CH5+ + CH3. CH3+ + CH4 C2H5+ + H2. Collisions Between sample molecule and CH5+ & C2H5+ are highly reactive. Involve proton or hydride transfer. CH5+ + MH MH2+ + CH4 proton transfer. C2H5+ + MH MH2+ + C2H4 proton transfer. C2H5+ + MH M+ +C2H6 hydride transfer. Proton transfer (M + 1)+ Hydride transfer (M – 1)+ C2H5+ transfer (M + 29)+ CI. Soft. Ionization. EI. Hard. Ionization.")
30
Ion Sources: Matrix-Assisted Laser Desorption/Ionization (MALDI)
Accurate MW for polar biopolymers DNA, RNA, Proteins Few thousands to several hundred thousand Da Sample is mixed with large excess of radiation-absorbing matrix material Solution is evaporated onto solid surface Sample exposed to pulsed laser beam Sublimation of analyte ions MS spectra recorded between laser beam pulses

31
Ion Sources: Simulation of MALDI
Matrix-Assisted Laser Desorption/Ionization (MALDI) Low background noise At high MW, matrix causes significant background at low MW Absence of fragmentation Multiple charged ions (+2, +3) Observe dimers trimers Mechanism is not completely understood Matrix compound must absorb the laser radiation Soluble enough in sample solvent to be present in large excess Analyte should not absorb laser radiation Fragmentation will occur Simulation of MALDI
 Low background noise. At high MW, matrix causes significant background at low MW. Absence of fragmentation. Multiple charged ions (+2, +3) Observe dimers trimers. Mechanism is not completely understood. Matrix compound must absorb the laser. radiation. Soluble enough in sample solvent to be. present in large excess. Analyte should not absorb laser radiation. Fragmentation will occur. Simulation of MALDI.")
32
Ion Sources: Matrix-Assisted Laser Desorption/Ionization (MALDI)
MALDI spectra are greatly influenced by type of matrix, solvent and additive At high MW, matrix causes significant background at low MW Dariusz Janecki et al. (2002) ASMS
 ASMS.")
33
Ion Sources: Electrospray Ionization (ESI)
One of the most important techniques for analyzing biomolecules Polypeptides, proteins and oligonucleotides Inorganic species synthetic polymers MW >100,000 Da Uses atmospheric pressure and temperature Sample pumped through a stainless steel capillary Rate of a few mls per minute Needle at several KVs potential Creates charged spray of fine droplets

34
Ion Sources: Electrospray Ionization (ESI)
Passes through desolvating capillary Evaporation of solvent Attachment of charge to analyte molecule Molecules become smaller charge density becomes greater desorption of ions into ambient gas

35
Ion Sources: Electrospray Ionization (ESI)
Little fragmentation of thermally fragile biomolecules Ions are multiply charged m/z values are small Detectable with quadrupole with mass range of 1500 or less Average charge state increases ~linearly with MW MW determined from peak distribution

36
Ion Sources: Fast Atom Bombardment Sources (FAB)
Major role for MS studies of polar high molecular-weight species Soft Ionization technique MW > 10,000 Structural information for MW ~3,000 Samples are in a condensed state Glycerol solution matrix Liquid matrix helps reduce lattice energy Ionized by bombardment with energetic (several keV) xenon or argon atoms Very rapid sample heating Reduces sample fragmentation Positive & negative analyte ions are sputtered from the surface Desorption process Must overcome lattice energy to desorb an ion and condense a phase “healing” the damage induced by bombardment
 xenon or argon atoms. Very rapid sample heating. Reduces sample fragmentation. Positive & negative analyte ions are sputtered from the surface. Desorption process. Must overcome lattice energy to desorb an ion and condense a phase. healing the damage induced by bombardment.")
37
Ion Sources: Fast Atom Bombardment Sources (FAB)
Beam of fast energetic atoms are generated by: Passing accelerated argon or xenon ions from an ion source through a chamber Chamber contains argon or xenon atoms at 10-5 torr High-velocity ions undergo a resonant electron-exchange reaction without substantial loss of translational energy Focusing Extraction plate Analyte ion beam (secondary ions) Probe tip Analyte metrix Atom beam Production of “fast atoms” Ar+* Ar > Ar Ar0* Charge transfer Accelerated argon ion from “ion gun” Ground state argon atom “slow ion” “fast atom”
 Probe tip. Analyte metrix. Atom beam. Production of fast atoms Ar+* + Ar > Ar+ + Ar0* Charge transfer. Accelerated argon ion from ion gun Ground state argon atom. slow ion fast atom")
38
Example 23: Identify the ions responsible for the peaks in the following mass spectrum for 1,1,1,2-tetrachloroethane (C2H2Cl4): MW =

39
Double-Focusing analyzer
Mass analyzers: Double-Focusing analyzer Two devices for focusing an ion beam Electrostatic analyzer Magnetic sector analyzer Ions accelerated through slit into curved electrostatic field Focus beam of ions with narrow band of kinetic energies into slit Ions enter curved magnetic field Lighter ions deflected more than heavier ions

40
Mass analyzers: Double-Focusing analyzer
Curved magnetic field of 180, 90 or 60 degrees Vary magnetic field strength or accelerating potential to select for ions of different mass Kinetic energy of accelerated ion (before magnetic field) where: V = voltage v = ion velocity e = electronic charge (1.60x10⁻¹⁹C) z = ion charge Path through magnet depends on the balance of two forces: Magnetic force (FM) and centripetal force (Fc) B = magnetic field strength r = radius of curvature of magnetic sector Substitute velocity into kinetic energy equation Select masses by varying B by changing current in magnet
 where: V = voltage v = ion velocity e = electronic charge (1.60x10⁻¹⁹C) z = ion charge. Path through magnet depends on the balance of two forces: Magnetic force (FM) and centripetal force (Fc) B = magnetic field strength r = radius of curvature of magnetic sector. Substitute velocity into kinetic energy equation. Select masses by varying B by changing current in magnet.")
41
Mass analyzers: Double-Focusing analyzer

42
Quadrupole mass analyzer
Mass analyzers: Quadrupole mass analyzer More compact, less expensive, rugged High scan rate spectrum in < 100ms Four parallel cylindrical rods serve as electrodes Opposite rods are connected electrically One pair attached to positive side of variable dc source One pair attached to negative side of variable dc source Variable radio-frequency ac potential (180o out of phase) applied to each pair of rods Ions accelerated through space between rods Potential of 5 to 10 V ac and dc voltages increased simultaneously with ratio being constant All ions without specific m/z strike rods and become neutral only ions having a limited range of m/z reach transducer (detector)
 applied to each pair of rods. Ions accelerated through space between rods. Potential of 5 to 10 V. ac and dc voltages increased simultaneously with ratio being constant. All ions without specific m/z strike rods and become neutral. only ions having a limited range of m/z reach transducer (detector)")
43
Mass analyzers: Quadrupole mass analyzer Positive rods
Alternating ac causes ions to converge during positive arc and diverge during negative arc If ions strike rod during negative arc neutralized and removed by vacuum Striking a rod depends on: rate of movement through rod Mass to charge ratio Frequency and magnitude of the ac signal dc current effects momentum of ions Momentum directly related to square-root of mass More difficult to deflect heavy ions than lighter ions Prevents heavier atoms from striking rods High-pass mass filter

44
Mass analyzers: Quadrupole mass analyzer Negative rods
In the absence of ac, all positive ions drawn to rods annihilated Offset for lighter ions by ac Low-pass mass filter For ions to pass through the rods (band of ions): Significantly heavy to pass positive rods Significantly light to pass negative rods One pair attached to positive side of variable dc source One pair attached to negative side of variable dc source Adjusting ac & dc moves the center of band of ions which pass the rods
: Significantly heavy to pass positive rods. Significantly light to pass negative rods. One pair attached to positive side of variable dc source. One pair attached to negative side of variable dc source. Adjusting ac & dc moves the center of band of ions which pass the rods.")
45
Mass analyzers: Time of Flight (TOF) Mass Analyzers
Ions generated by bombardment of the sample with a brief pulse of: Electrons, secondary ions, laser-generated photons Frequency of pulse 10 to 50 kHz, duration of pulse 0.25 ms Ions accelerated by electric field pulse 103 to 104 V Same frequency of ionization pulse, but lags behind Accelerated particle enter field-free drift tube Ions enter tube with same kinetic energy Ion velocity vary inversely with mass Lighter particles arrive at detector before heavier particles Flight times are 1 to 30 ms Requires fast electronics Peak broadening due to variability in ion energies and initial position Limits resolution compared to magnets and quadrupole Less widely used than quadrupole Advantages: unlimited mass range, rapid data acquisition, simplicity, ruggedness, ease of access to ion source

46
Transducers (detectors) for Mass Spectrometry:
Electron Multipliers Detects positive ions Similar to photomultiplier used in UV/vis Each dynode held at successfully higher voltage Dynodes have Cu/Be surfaces Burst of electrons emitted when struck with energetic ions or electrons Electron multiplies contain upwards of 20 dynodes Typical current gain of 107 Continuous-Dynode electric multiplier Glass that is heavily doped with lead Potential of 1.8 to 2 V across length of transducer Trumpet shaped Ions strike surface near entrance that ejects electrons Electrons then skip along surface ejecting more electrons with each impact Typical current gain of 105 to 108 Rugged, reliable with high current gains Positioned directly at the exit slit of magnet Ions have enough energy to eject electrons Requires accelerator with quadrupole MS

47
Transducers (detectors) for Mass Spectrometry: Faraday Cup
hollow collector, open at one end and closed at the other, used to collect beams of ions incident ion strikes the dynode surface which emits electrons induces a current which is amplified and recorded Surrounded by cage Prevents the escape of reflected ions and ejected secondary electrons Inclined with respect to ion beam Particles striking or leaving the electrode are reflected away from entrance Connected to ground potential through a large resistor Ions striking plate are neutralized by flow of electrons from resistor Causes a potential drop across resistor Independent of the energy, mass or chemical nature of ion Inexpensive and simple mechanical and electronic device Disadvantages: Need for a high-impedance amplifier Limits speed at which spectrum can be scanned Less sensitive than electron multipliers

48
Atomic Mass Spectra and Interferences: Spectroscopic interference
An ionic species in the plasma has the same m/z values as an analyte Isobaric interference Two elements that have isotopes with nearly the same mass Differ by less than 1 amu 113In+ overlaps with 113Cd+ and 115In+ overlaps with 115Sn+ Isobaric interference occurs with the most abundant and most sensitive isotope 40Ar+ overlaps with 40Ca+ (97%) need to use 44Ca+ (2.1%) 58Ni+ overlaps with 56Fe+ need to use 56Fe+ Exactly predictable from abundance tables Polyatomic ion interference More serious than isobaric Polyatomic species form from interactions with species in plasma, matrix or atmosphere Several molecular ions can form and interfere Typically observed for m/z < 82 amu Potential interference: 40Ar2+, 40ArH+, 16O2+, H216O,16OH+, 14N+ Serious interference: 14N2+ with 28Si+, NOH+ with 31P+, 16O2+ with 32S+, 40ArO+ with 56Fe+, 40Ar2+ with 80Se+ Correct with blank
 need to use 44Ca+ (2.1%) 58Ni+ overlaps with 56Fe+ need to use 56Fe+ Exactly predictable from abundance tables. Polyatomic ion interference. More serious than isobaric. Polyatomic species form from interactions with species in plasma, matrix or atmosphere. Several molecular ions can form and interfere. Typically observed for m/z < 82 amu. Potential interference: 40Ar2+, 40ArH+, 16O2+, H216O,16OH+, 14N+ Serious interference: 14N2+ with 28Si+, NOH+ with 31P+, 16O2+ with 32S+, 40ArO+ with 56Fe+, 40Ar2+ with 80Se+ Correct with blank.")
49
Atomic Mass Spectra and Interferences: Spectroscopic interference
Oxide and Hydroxide species interference Most serious Oxides an hydroxides of analyte, matrix solvent plasma gases MO+ and MOH+ ions Formation depends on injector flow rate, RF power, sampler skimmer spacing, sample orifice size, plasma gas composition, oxygen elimination solvent removal efficiencies Matrix Effects Occur at concentrations > 500 to 1000 mg/ml Reduction in analyte signal, sometimes signal enhancement General effect Minimized by using more dilute solutions, altering sample introduction procedure or by separating out offending species Use internal standard to correct effect Affect of pesticide response to matrix effects Add protectant to remove matrix effect Analytical Sciences 2005, 21, 1291

50
Fourier Transform (FT) MS: Improves signal-to-noise ratios
Greater Speed Higher sensitivity and resolution Requires an Ion Trap Ions are circulated in well-defined orbits for extended periods Ion cyclotron resonance (ICR) Ions in a magnetic field circulate in a plane perpendicular to the direction of the field Angular frequency of this motion cyclotron frequency (wc) Ion trapped in a magnetic field can absorb energy from an ac electric field Frequency of field must match cyclotron frequency Absorbed energy increases velocity of ion and radius without affecting wc
 Ions in a magnetic field circulate in a plane perpendicular to the direction of the field. Angular frequency of this motion cyclotron frequency (wc) Ion trapped in a magnetic field can absorb energy from an ac electric field. Frequency of field must match cyclotron frequency. Absorbed energy increases velocity of ion and radius without affecting wc.")
51
Fourier Transform (FT) MS: Detection of ICR
Ions circulating between plates induces current between plates Image current Non-destructive Decays over a few seconds through collision Decay over time of the image current after applying an RF pulse is transformed from the time domain into a frequency domain Ions of two different m/q ratios excited on resonance for the same amount of time with the same excitation voltage. Ion [A] has the lower m/q ratio and thus has a higher cyclotron frequency. Ion [B] has the higher m/q ratio and thus a lower cyclotron frequency.

Similar presentations

 the elemental composition of samples of matter.>")

 and obtaining.>")


 is based upon emission of electromagnetic radiation by atoms.>")


 Today’s Lecture Mass Spectrometry.>")


, atomic and molecular weights are generally expressed in terms of atomic.>")


