Download presentation
Presentation is loading. Please wait.

1
Habitat Group Lake Champlain Watershed Regional Risk Model Daniel Levy Kelsey Pratt Tyler Lewis

2
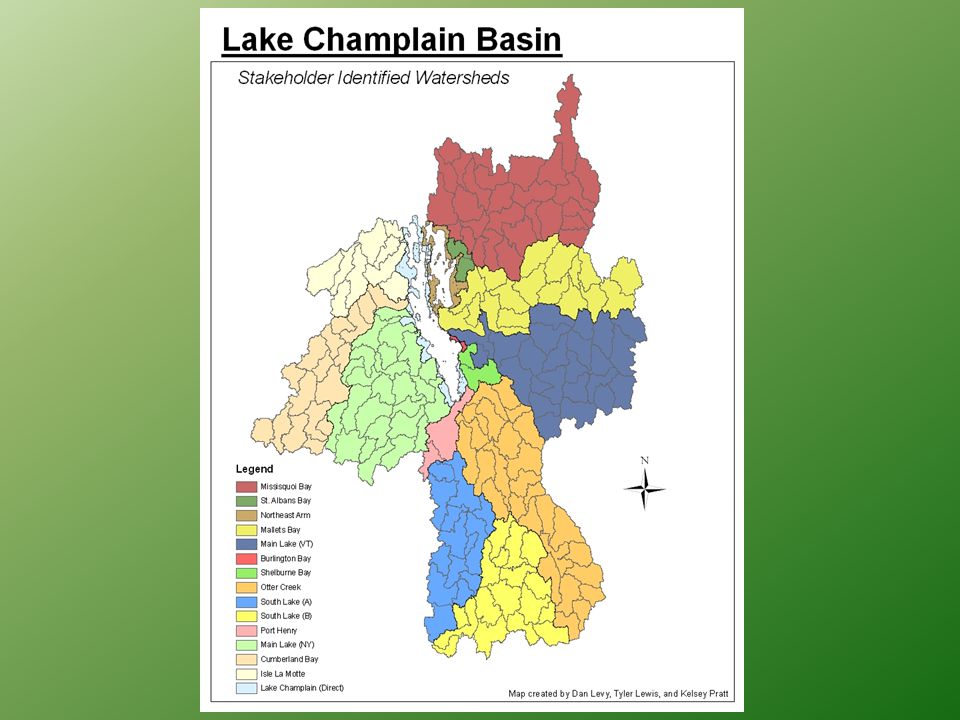
Problem Statement & Objectives Lake Champlain Basin Program identifies fifteen different watersheds. 1.Designating watersheds. 2.Identifying Important Habitats on Regional Scale 3.Determining Ranking values and possible implementation of a Habitat Filter.

3
Watershed Determination There are three proposals that need to be considered: 1. Focusing on Hydrologic Units 2.Specific Stakeholder Identified Watersheds 3.Watershed Segments by State

7
Identifying Important Habitats Open water: – Lake Champlain <6’ >6’ – Lakes/Ponds other than Lake Champlain – Rivers and Streams Developed: – Open space – Low intensity – Medium intensity – High intensity – Barren land (rock/sand/clay including mine pits and gravel sites) Forest: – Deciduous – Coniferous – Mixed Herbaceous: – Shrub – Grassland Agriculture: – Pasture/hay – Cultivated crops Wetlands: – Woody wetlands – Emergent herbaceous wetlands
 Forest: – Deciduous – Coniferous – Mixed Herbaceous: – Shrub – Grassland Agriculture: – Pasture/hay – Cultivated crops Wetlands: – Woody wetlands – Emergent herbaceous wetlands")
8
Determining Ranking Values 1.Land Mass Ranking 2.Economic Ranking 3.Habitat Filter(s)
")
9
Habitat's Land Mass Habitat Located In Watershed Ranking Option 1 (No Economic Rankings) Ranking Option 2 Ranking Option 3 Ranking Option 4 Ranking Option 5 None00000 Low21111 Medium42.5232 High64354 Ranking Values are Determined by the Ratio of Habitat Size : Watershed Size
 Ranking Option 2 Ranking Option 3 Ranking Option 4 Ranking Option 5 None00000 Low21111 Medium High64354 Ranking Values are Determined by the Ratio of Habitat Size : Watershed Size")
10
Economic Rankings Economic values are assigned to each habitat based on it's possible "Goods Value(s)". 1.Open Waters 2.Developed 3.Forest 4.Herbaceous 5.Agricultural 6.Wetlands Categories Retrieved from the Bureau of Economic Analysis:

11
Layout of Economic Categories and Findings FIPSStateIndustry CodeIndustryComponent CodeComponent200620072008AVERAGEPERCENT 50Vermont1All industry total200Gross Domestic Product by State (millions of current dollars)236512423724993 OPEN WATER 50Vermont5 Forestry, fishing, and related activities200Gross Domestic Product by State (millions of current dollars)76747374.333330.01% 50Vermont10 Utilities200Gross Domestic Product by State (millions of current dollars)534576586565.33330.05% 0.06% DEVELOPED 50Vermont12 Manufacturing200Gross Domestic Product by State (millions of current dollars)3012267029172866.3330.27% 50Vermont34 Wholesale trade200Gross Domestic Product by State (millions of current dollars)11671175118611760.11% 50Vermont35 Retail trade200Gross Domestic Product by State (millions of current dollars)2032204619812019.6670.19% 0.56% FOREST 50Vermont5 Forestry, fishing, and related activities200Gross Domestic Product by State (millions of current dollars)76747374.333330.01% 50Vermont14 Wood product manufacturing200Gross Domestic Product by State (millions of current dollars)130118114120.66670.01% 50Vermont29 Paper manufacturing200Gross Domestic Product by State (millions of current dollars)10910096101.66670.01% 0.03% HERBACEOUS 50Vermont5 Forestry, fishing, and related activities200Gross Domestic Product by State (millions of current dollars)76747374.333330.01% AGRICULTURE 50Vermont4 Crop and animal production (Farms)200Gross Domestic Product by State (millions of current dollars)2183533052920.03% 50Vermont26 Food product manufacturing200Gross Domestic Product by State (millions of current dollars)389411444414.66670.04% 0.07% WETLANDS 50Vermont5 Forestry, fishing, and related activities200Gross Domestic Product by State (millions of current dollars)76747374.333330.01%
 OPEN WATER 50Vermont5 Forestry, fishing, and related activities200Gross Domestic Product by State (millions of current dollars) % 50Vermont10 Utilities200Gross Domestic Product by State (millions of current dollars) % 0.06% DEVELOPED 50Vermont12 Manufacturing200Gross Domestic Product by State (millions of current dollars) % 50Vermont34 Wholesale trade200Gross Domestic Product by State (millions of current dollars) % 50Vermont35 Retail trade200Gross Domestic Product by State (millions of current dollars) % 0.56% FOREST 50Vermont5 Forestry, fishing, and related activities200Gross Domestic Product by State (millions of current dollars) % 50Vermont14 Wood product manufacturing200Gross Domestic Product by State (millions of current dollars) % 50Vermont29 Paper manufacturing200Gross Domestic Product by State (millions of current dollars) % 0.03% HERBACEOUS 50Vermont5 Forestry, fishing, and related activities200Gross Domestic Product by State (millions of current dollars) % AGRICULTURE 50Vermont4 Crop and animal production (Farms)200Gross Domestic Product by State (millions of current dollars) % 50Vermont26 Food product manufacturing200Gross Domestic Product by State (millions of current dollars) % 0.07% WETLANDS 50Vermont5 Forestry, fishing, and related activities200Gross Domestic Product by State (millions of current dollars) %")
12
Layout of Economic Ranking Options Economic Contribution Option 1Option 2 LOW10 MEDIUMN/A1 HIGH22

13
Economic Uncertainty When applying the GDP values for the state of New York, its metropolitan areas provided substantial economic stimuli, thus drastically inflating the State's values.

14
Economic Results New YorkVermontQuebec** %Rank% % OPEN WATER1.71%10.06%1 DEVELOPED15.97%*20.56%2 FOREST0.24%10.03%1 HERBACEOUS0.03%00.01%0 AGRICULTURE0.84%10.07%1 WETLANDS0.03%00.01%0 *Inflation due to New York City **In progress

15
Habitat Stakeholder Importance Filter Habitats WatershedsLC* depth <6'LC* depth >6'Lakes/PondsRivers/StreamsDevelopedForestHerbaceousAgricultureWetlands Missisquoi Bay 1 11 1 11 11 1 St. Albans Bay 1 1 1 1 1 1 1 1 1 Northeast Arm 1 1 1 1 1 1 1 1 1 Mallets Bay 1 1 1 1 1 1 1 1 1 Main Lake VT 1 1 1 1 1 1 1 1 1 Burlington Bay 1 1 1 1 1 1 1 1 1 Shelburne Bay 1 1 1 1 1 1 1 1 1 Otter Creek 1 1 1 1 1 1 1 1 1 South Lake B 1 1 1 1 1 1 1 1 1 South Lake A 1 1 1 1 1 1 1 1 1 Port Henry 1 1 1 1 1 1 1 1 1 Main Lake NY 1 1 1 1 1 1 1 1 1 Cumberland Bay 1 1 1 1 1 1 1 1 1 Isle La Motte 1 1 1 1 1 1 1 1 1 Lake Champlain 11 1 11 11 11 Enables local stakeholders to express the personal value that individual habitats are to them. Filter values are suggested to range between Zero and two : 0, 0.5, 1.0, 1.5, 2.0

16
Invasive and Endangered Species Limitations Inflation in the rank would result if endangered species occurred, but was not continuous throughout the habitat type within the sub-basin. Not assigning values would allow for stronger accuracy. This approach could cause limitations when portraying highly “important” areas in each watershed. Field research would have to be conducted.

Similar presentations


>")


 Consortium Great Lakes Regional Data Exchange Land Cover / Land Use Chicago, IL April 27, 2005 Steve Raber.>")


>")

