Download presentation
Presentation is loading. Please wait.

1
Repeat speeding offenders – Time to stop thinking of them as just ‘unlucky normal’ drivers Dr Judy Fleiter CRICOS No. 00213J Edmonton’s International Conference on Urban Traffic Safety, 23-26 April 2012

2
Acknowledgements Co-researchers –Barry Watson, Vic Siskind, Angela Watson Australian Research Council –Department of Transport and Main Roads –Queensland Police Service –Office of Economic and Statistical Research Australian Postgraduate Award

3
Overview Speeding and crash involvement in Australia Speeding recidivist research in Queensland Challenges from an Australian perspective Defining speeding Community attitudes to speeding Auditor-General reviews of speed camera programs Implications for future speed management

4
Australia Brisbane Australia = 22.8 million people Queensland = 4.5 million people Land area = 1.7 million km 2 Driver’s licences = 3.1 million Reg.vehicles = 4.3 million

5
Australian Road Deaths: Improvements from 1970-2010 30.4 deaths/100,000 people6.1 deaths/100,000 people With a 2-fold increase in vehicles & 50% growth in population

6
Improvements in Road Safety in Queensland since 1967

7
Speed management in Australia (1) Over the last 2 decades, jurisdictions have adopted a ‘holistic’ approach to reducing speeding: –Road environment improvements (e.g. lower urban speed limits, school zones, road treatments) –Enforcement programs (e.g. traffic patrols, fixed & mobile speed cameras, point-to-point cameras) –Education programs (e.g. mass media education) –Intelligent Transport System (ITS) measures (e.g. vehicle activated and variable message signs)
 –Enforcement programs (e.g. traffic patrols, fixed & mobile speed cameras, point-to-point cameras) –Education programs (e.g. mass media education) –Intelligent Transport System (ITS) measures (e.g. vehicle activated and variable message signs).")
8
Speed management in Australia (2) Strong reliance on traffic law enforcement programs: −traffic laws (eg. speed limits) −traffic policing (eg. speed cameras) −sanctions (eg. fines, demerit points, licence loss)
 −traffic policing (eg. speed cameras) −sanctions (eg. fines, demerit points, licence loss).")
9
Speeding enforcement in Queensland History: –1997: Mobile speed cameras (highly visible, randomly deployed around selected ‘crash’ sites) –2003:Penalties for speeding substantially increased –2007: Fixed ‘blackspot’ speed cameras and increase in mobile speed camera sites –2010:Covert speed cameras introduced –2011:Point-to-point (average) speed cameras operational on 1 section of highway north of Brisbane Policing supported by mass-media education Evaluations of mobile speed cameras indicate: −34% reduction in fatal crashes within 2km of sites −42% reduction in serious casualty crashes within 2km Newstead, 2006; Cameron, 2008; Carnis, Rakotonirainy & Fleiter, 2008
 –2003:Penalties for speeding substantially increased –2007: Fixed ‘blackspot’ speed cameras and increase in mobile speed camera sites –2010:Covert speed cameras introduced –2011:Point-to-point (average) speed cameras operational on 1 section of highway north of Brisbane Policing supported by mass-media education Evaluations of mobile speed cameras indicate: −34% reduction in fatal crashes within 2km of sites −42% reduction in serious casualty crashes within 2km Newstead, 2006; Cameron, 2008; Carnis, Rakotonirainy & Fleiter, 2008")
10
Focus of Traffic Policing The Fatal 4 –Speeding –Drink driving –Fatigue – driving while tired –Non-use of Seatbelts

12
CRICOS No. 00213J Percentage of fatalities involving speeding drivers/riders in Queensland: 12 months ending January 2006 -2011 Year % Queensland Department of Transport and Main Roads, 2011

13
Percentage of speeding infringements per penalty category, Queensland Km/hour above the speed limit % of infringements Queensland Transport, 2008

15
Speeding offenders... Are they all the same? Does increasing penalties make any difference? What else do they do? How do they perceive current penalties? What might best change their driving behaviour?

16
Background to recidivism research project In April 2003, Queensland introduced changes to the speeding penalty regime: –Increased monetary fines –Automatic licence suspension for high range speeding (for >40 km/h over the speed limit) –Increased the number of offence bands/categories The stated rationale for this change was to deter speeding behaviour
 –Increased the number of offence bands/categories The stated rationale for this change was to deter speeding behaviour")
17
Speeding penalty changes Speeding offences and penalties in Qld prior to 17 April, 2003 Speeding offences and penalties in Qld from 17 April, 2003 OffenceFineDemerit Points <15 km/hr over speed limit$901 15-29 km/hr over speed limit$1353 30-44 km/hr over speed limit$1804 >44 km/hr over speed limit$2556 OffenceFineDemerit Points <13 km/hr over speed limit$1001 13-20 km/hr over speed limit$1503 21-29 km/hr over speed limit$2504 30-40 km/hr over speed limit$3006 >40 km/hr over speed limit$7008 + 6 months suspension

18
The effectiveness of increases in speeding penalties Limited international research into effectiveness of different speeding penalties Increasing speeding penalties severity (in isolation) has been found to produce very few impacts on behaviour in Sweden (1982 & 1987) and Norway (1995-2004) Need to consider impact of speeding penalties in: –deterring the general population from speeding (general deterrence) –reducing recidivism among offenders (specific deterrence) Watson et al. 2010
19
Speeding recidivism research Our research aimed to: examine the specific deterrent impact of the changes profile speeding offenders/recidivists

20
Method (1) Crash and offence data from 1996 to 2007 obtained for two cohorts of drivers: 58,000 drivers convicted of speeding in May 2001 53,000 drivers convicted of speeding in May 2003 Data obtained included details of: –index offence –previous and subsequent traffic crashes and offences –demographic characteristics –licence type and class
 Crash and offence data from 1996 to 2007 obtained for two cohorts of drivers: 58,000 drivers convicted of speeding in May 2001 53,000 drivers convicted of speeding in May 2003 Data obtained included details of: –index offence –previous and subsequent traffic crashes and offences –demographic characteristics –licence type and class")
21
Method (2) Final sample for current analyses excluded interstate and international licence holders: –2001 pre-penalty change cohort (n = 46,681) –2003 post-penalty change cohort (n = 42,180) Speeding offence records for two years after the index offence were examined Distinction between: Absolute specific deterrence – the total prevention of re-offending Marginal specific deterrence – a reduction in re-offending
 Final sample for current analyses excluded interstate and international licence holders: –2001 pre-penalty change cohort (n = 46,681) –2003 post-penalty change cohort (n = 42,180) Speeding offence records for two years after the index offence were examined Distinction between: Absolute specific deterrence – the total prevention of re-offending Marginal specific deterrence – a reduction in re-offending")
22
Measures of recidivism In the follow up period: 1. Proportion of all offenders detected re-offending (Absolute specific deterrence) 2. Average number of offences (Absolute and marginal specific deterrence) 3. Length of delay to re-offence among re-offenders (Marginal specific deterrence) 4. Average number of re-offences among re- offenders (Marginal specific deterrence) CRICOS No. 00213J
 2. Average number of offences (Absolute and marginal specific deterrence) 3. Length of delay to re-offence among re-offenders (Marginal specific deterrence) 4. Average number of re-offences among re- offenders (Marginal specific deterrence) CRICOS No J.")
23
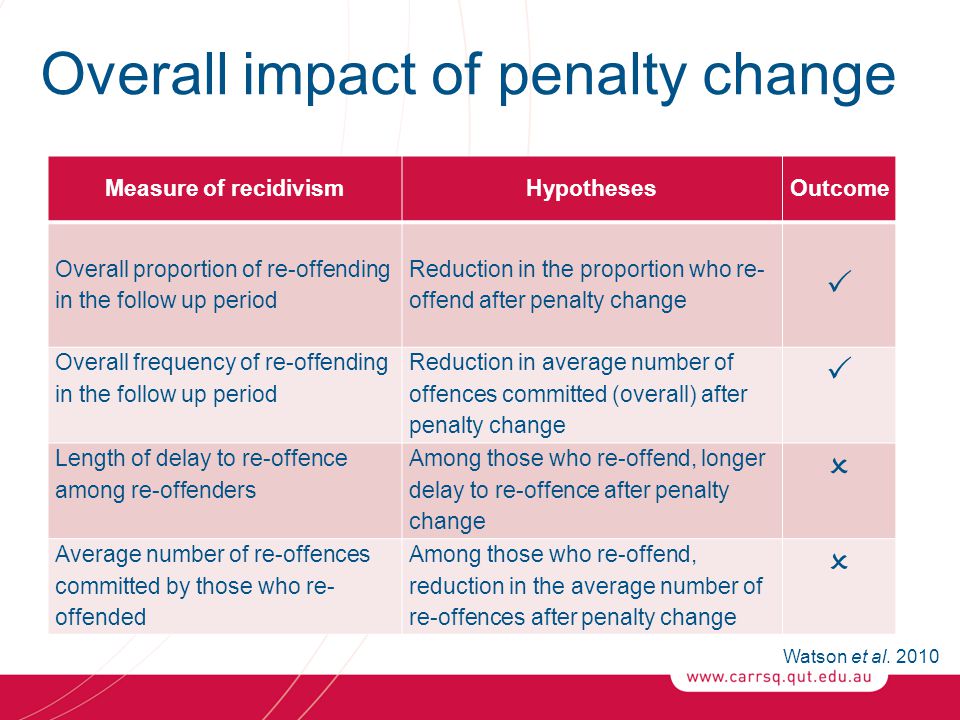
Overall impact of penalty change Measure of recidivismHypothesesOutcome Overall proportion of re-offending in the follow up period Reduction in the proportion who re- offend after penalty change Overall frequency of re-offending in the follow up period Reduction in average number of offences committed (overall) after penalty change Length of delay to re-offence among re-offenders Among those who re-offend, longer delay to re-offence after penalty change Average number of re-offences committed by those who re- offended Among those who re-offend, reduction in the average number of re-offences after penalty change Watson et al. 2010
24
Potential influencing factors – differential effects 1.Index offence severity 2.Offence history

25
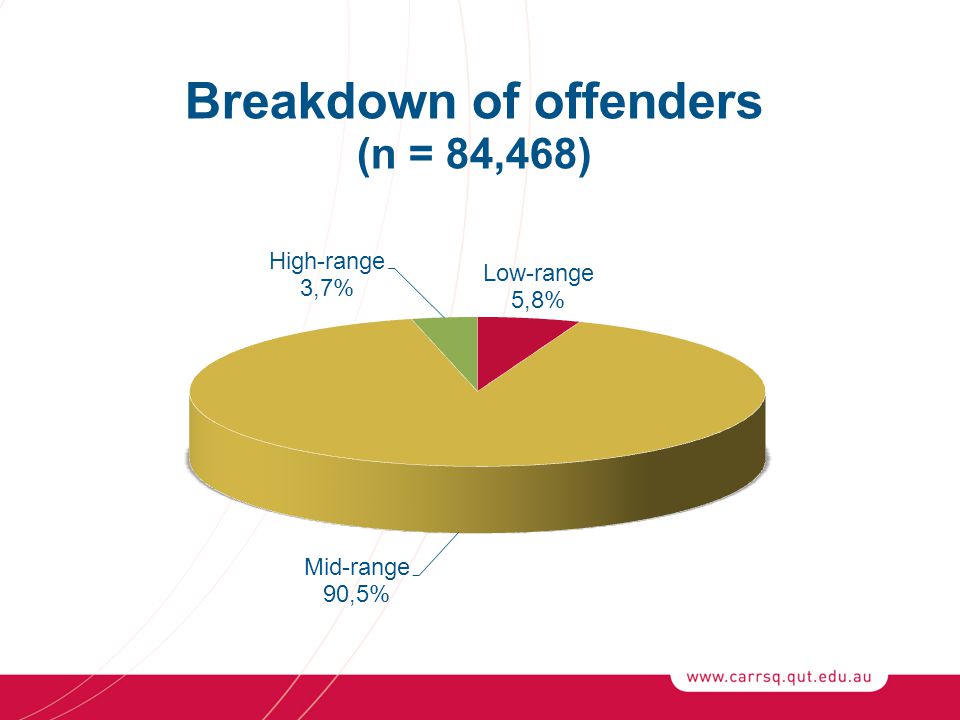
1. Index Offence Severity Low-range offences: those from the lowest offence category High-range offences: those that were 30km/hr or greater over the speed limit Mid-range offences: all other offences

26
Effects of index offence severity Compared to those with mid- and low-range offences, those with high-range index offence had a significantly: −greater proportion re-offending; −higher average number of offences; and −higher average number of re-offences. No differential effects of penalty change

27
2. Offence History Low-range offenders: no speeding offences prior to index High-range offenders: 2 or more speeding offences prior to index, where at least two were 30 km/hr or greater over the speed limit Mid-range offenders: all other offenders

28
Effects of offence history Compared to mid- and low-range offenders, high-range offenders had a significantly: −greater proportion re-offending; −higher average number of offences; −fewer days until re-offence; and −higher average number of re-offences. No differential effects of penalty change

29
Potential Confounding Factors 1.Intensity of speed enforcement –Speed enforcement hours 2. Community perceptions –Annual community attitudes surveys 3. Driving exposure –Fuel sales

30
1. Intensity of speed enforcement Speed enforcement Measure* 2001 Cohort period May 2001 – April 2003 2003 Cohort period May 2003 – April 2005 Percentage change Hours of operation 414,699594,09343% Number of offences detected 1,170,3731,121,735- 4% Detection rate 2.821.89 * Includes all speed camera and radar based speed enforcement

31
2. Community perceptions The trend in self-reported exposure (self and others) to speed cameras was stable from 1998 to 2005. Reported awareness of penalty change: –69% in 2003 –39% in 2004 However, knowledge of the penalty change varied in terms of accuracy.
 to speed cameras was stable from 1998 to Reported awareness of penalty change: –69% in 2003 –39% in 2004 However, knowledge of the penalty change varied in terms of accuracy..")
32
3. Driving exposure Time periodLitres sold*%change Pre-penalty change May 2001 – April 20034,515,314,862 Post-penalty change May 2003 – April 20055,902,016,763 30.71% increase There was an increase in fuel sales from 2001-03 to 2003-05 period. As such, the results obtained in the study would not appear to be due to any reduction in driving exposure. *All fuel types sold by fuel retail outlets in Queensland

33
Speeding offenders... Are they all the same? Does increasing penalties make any difference? What else do they do? How do they perceive current penalties? What might best change their driving behaviour?

34
Speeding recidivists

35
Speeding recidivist profiling (1) Examined demographic characteristics, traffic offence histories and criminal histories of speeding offenders Compared characteristics and offence histories of low and mid-range offenders with high-range, repeat speeding offenders
 Examined demographic characteristics, traffic offence histories and criminal histories of speeding offenders Compared characteristics and offence histories of low and mid-range offenders with high-range, repeat speeding offenders")
36
Speeding recidivist profiling (2) Utilised the data from the speeding penalty change study for the combined 2001 and 2003 cohorts (because no differences on key variables of interest) Examined five years of traffic offence history, prior to the index speeding offence Examined lifetime criminal history Watson et al. 2009

37
Speeding recidivist profiling (3) Three classifications of offenders were determined ‘a priori’ –Low-range: one offence less than 15km/hr over speed limit during study timeframe –Mid-range: at least one offence more than 15km/hr over the speed limit –High-range: two or more offences, with at least two being 30 km/hr or more over the speed limit (i.e. high range, repeat offenders)
.")
39
Previous profiling results (1) Significant differences between high-range offenders compared to low- and mid-range offenders Demographics - High-range offenders more likely: –Male –Younger –Hold Provisional licence –Hold Motorcycle licence
 Significant differences between high-range offenders compared to low- and mid-range offenders Demographics - High-range offenders more likely: –Male –Younger –Hold Provisional licence –Hold Motorcycle licence")
40
Previous profiling results (2) Traffic History High-range offenders more likely than low- and mid-range offenders to have committed: –Alcohol –Unlicensed driving –Dangerous driving –Seatbelt, and –‘Other’ traffic offences in the 5 years prior to index offence
 Traffic History High-range offenders more likely than low- and mid-range offenders to have committed: –Alcohol –Unlicensed driving –Dangerous driving –Seatbelt, and –‘Other’ traffic offences in the 5 years prior to index offence")
41
Additional results

42
Crash history Low-range vs. high-range: 2 (1) = 358.6, p <.001, c =.21 Mid-range vs. high-range: 2 (1) = 286.2, p <.001, c =.06
 = 286.2, p <.001, c =.06.")
43
Compared to low- and mid- range offenders... High-range offenders involved in significantly greater proportion of single-vehicle crashes A significantly greater proportion of high-range offenders had ‘speed’ allocated as a contributing circumstance in crash But for multi-vehicle crashes, no significant differences between offender types for most-at- fault in a crash.

44
Speeding offenders... Are they all the same? Does increasing penalties make any difference? What else do they do? How do they perceive current penalties? What might best change their driving behaviour?

45
Criminal histories 1000 offenders selected –300 random sample of low-range –300 random sample of mid-range –400 random sample of high-range Data provided by Queensland Police Service Overall, 30.5% had at least one criminal offence –15.9% property (eg. stealing, break and enter) –14.9% drug offences –10.2% offences against order (eg. public nuisance) –7.3% offences against the person (eg. assault) –7.2% traffic offences (ie. those requiring attendance at court) –4.6% regulation offences (eg. prostitution, liquor licensing)
 –14.9% drug offences –10.2% offences against order (eg. public nuisance) –7.3% offences against the person (eg. assault) –7.2% traffic offences (ie. those requiring attendance at court) –4.6% regulation offences (eg. prostitution, liquor licensing).")
46
Comparison of criminal histories Low-range offenders Mid-range offenders High-range offenders Overall Criminal history 7.0%21.0%55.2% Property* 38.1%44.4%44.3% Drug* 14.3%36.5%53.8% Person* 14.3%15.9%27.1% Traffic* 52.4%28.6%19.5% Order* 14.3%28.6%36.7% Regulation* 4.8%3.2%19.5% Standardised residuals +/- 1.96 bolded *% of those with criminal history

47
Conclusions for recidivism research The introduction of more severe speeding penalties in Queensland appears to have had a absolute specific deterrent effect and reduced re-offending in the following two years However, the change appears to have had little impact on the overall frequency of re-offending among those who did re-offend Further research into the effectiveness of speeding penalties and sanctions needed

48
Conclusions for recidivism research High-range, repeat speeding offenders appear to be a problematic group of drivers The are substantially different from low- and mid- range offenders on many demographic, traffic and criminal history factors Need to consider innovative, tailored strategies for reducing recidivism among high-range, repeat offenders

49
Speeding offenders... Are they all the same? Does increasing penalties make any difference? What else do they do? How do they perceive current penalties? What motivates non-compliance? Why don’t penalties make a difference to some offenders? What might best change their driving behaviour?

50
Understanding driver perceptions Key part of speed management Important to understand Can provide insight into behaviour Can provide direction for future countermeasures

51
Focus group interviews Qualitative exploration Queensland car drivers (n=67) Participants –Community members & university students –Purposive sampling (8 types) –Stratified by age, gender & self-identified speeding ‘Excessive’ vs. ‘Rare’ speeders Fleiter, Lennon & Watson, 2007; 2010

52
Definitions of Speeding (1) 1.Excess, illegal, over-speeding –Any amount above the posted limit 2.Inappropriate speed –unsuitable for the prevailing road and traffic conditions (WHO, 2004) 3.A ‘psychological’ definition of speeding? What does speeding mean to you?

53
Definitions of Speeding (2) ‘Technical’ definition widely acknowledged Examples of compliance –Safe; speeding unnecessary; moral imperative “It’s a choice to be as safe as I can be.’’ Male, 39 years
 ‘Technical’ definition widely acknowledged Examples of compliance –Safe; speeding unnecessary; moral imperative It’s a choice to be as safe as I can be.’’ Male, 39 years")
54
Definitions of Speeding (3) Justifications for non-compliance –Compliance is discretionary not mandatory (personal choice) –Safe (vehicle design, control) –Enforcement tolerance perceptions 10% and 10 km/hour –‘Outdated’/unreasonably low limits –Depends on speed zone/road type
 Justifications for non-compliance –Compliance is discretionary not mandatory (personal choice) –Safe (vehicle design, control) –Enforcement tolerance perceptions 10% and 10 km/hour –‘Outdated’/unreasonably low limits –Depends on speed zone/road type")
55
Definitions of Speeding (4) “Actually, I’ll be honest, I’ve lived here 24 years and I don’t even know what the speed limit is out on our roads….I don’t even know what speed I drive, I just get in and drive.” Female, 53 years “I see it [speeding] as road management. I don’t look at what speed I’m driving, I’m just going by instinct.” Male, 58 years
![Definitions of Speeding (4) Actually, I’ll be honest, I’ve lived here 24 years and I don’t even know what the speed limit is out on our roads….I don’t even know what speed I drive, I just get in and drive. Female, 53 years I see it [speeding] as road management.](http://images.slideplayer.com/13/3831498/slides/slide_55.jpg "I don’t look at what speed I’m driving, I’m just going by instinct. Male, 58 years.")
56
Question... If you received a speeding ticket, who would you be embarrassed to tell?

57
Embarrassment Dichotomy (1) ‘Hide the ticket’ vs. ‘No big deal’ ‘I wouldn’t tell my friends for fear they’d joke about it to their parents.’ ‘Yeah, I’d rather tell my parents than a friend’s parents. You wouldn’t really have respect from your friend’s parents.’ Not disclosing a ticket linked to -Not wanting to breach trust -Projecting responsible image

58
Embarrassment Dichotomy (2) ‘No big deal’ linked to: –Speeding viewed as widely acceptable –A common occurrence “I’m never embarrassed to tell anyone, and I never ever flinch when I get a ticket, because I’ve had that many… hundreds of them.” Male, 54 years “It’s just one of those occupational hazards in getting from A to B.” Male, 30 years Fleiter, Lennon & Watson, 2007; 2010
 ‘No big deal’ linked to: –Speeding viewed as widely acceptable –A common occurrence I’m never embarrassed to tell anyone, and I never ever flinch when I get a ticket, because I’ve had that many… hundreds of them. Male, 54 years It’s just one of those occupational hazards in getting from A to B. Male, 30 years Fleiter, Lennon & Watson, 2007; 2010")
59
Avoiding Detection & Penalty (1) For Excessive speeders, penalties appeared to have limited deterrent effect Avoiding detection –site learning (most common) –ability to detect covert enforcement Avoiding punishment –fraudulent demerit point use (opportunistic and systematic –driving while unlicensed
 For Excessive speeders, penalties appeared to have limited deterrent effect Avoiding detection –site learning (most common) –ability to detect covert enforcement Avoiding punishment –fraudulent demerit point use (opportunistic and systematic –driving while unlicensed")
60
Avoiding Detection & Penalty (2) “I think it’s [speeding] a lot more stressful at night ‘cause usually in your rear mirror, you can work out whether it’s a cop car. At night they can hide.” Female, 46 years “My [relative] buys points off people so he can keep driving. He gets them off other people for [$X] a point. My son’s got a friend they call the Points Man because he never speeds, so he just takes everyone’s tickets and gets $X for every point”. Female, 53 years
![Avoiding Detection & Penalty (2) I think it’s [speeding] a lot more stressful at night ‘cause usually in your rear mirror, you can work out whether it’s a cop car.](http://images.slideplayer.com/13/3831498/slides/slide_60.jpg "At night they can hide. Female, 46 years My [relative] buys points off people so he can keep driving. He gets them off other people for [$X] a point. My son’s got a friend they call the Points Man because he never speeds, so he just takes everyone’s tickets and gets $X for every point . Female, 53 years.")
61
The importance of community perceptions

62
Community attitudes & perceptions (1) Gradual increase in public awareness of speed-related risks through 1990s to early 2000s but has been stable in recent years Views of those opposed to stricter/more innovative speed management have considerable influence in Australia National Road Safety Strategy (2011-2020) highlighted the need for: ongoing dialogue with motoring groups and other stakeholders Improvement in community understanding of the need for compliance and of the social costs of low-level speeding for national dialogue to explain safety rationale of speed management Australian Transport Council, 2011; Petroulis, 2011
 Gradual increase in public awareness of speed-related risks through 1990s to early 2000s but has been stable in recent years Views of those opposed to stricter/more innovative speed management have considerable influence in Australia National Road Safety Strategy ( ) highlighted the need for: ongoing dialogue with motoring groups and other stakeholders Improvement in community understanding of the need for compliance and of the social costs of low-level speeding for national dialogue to explain safety rationale of speed management Australian Transport Council, 2011; Petroulis, 2011")
63
Community attitudes & perceptions (2) In 2011, the Auditor-General’s Office in 2 jurisdictions (New South Wales & Victoria) conducted reviews of speed camera programs Addressing community concern over use of cameras
 In 2011, the Auditor-General’s Office in 2 jurisdictions (New South Wales & Victoria) conducted reviews of speed camera programs Addressing community concern over use of cameras")
64
NSW Auditor-General’s report (1) “Improving Road Safety: Speed Cameras” Performance Audit Election commitment made before 2011 State Election Acknowledged much public debate 2 issues covered: –were speed cameras located in areas identified as having greatest road safety risk? –do speed cameras reduce speeding and the number and severity of road crashes in these locations? Public submissions invited on how to improve speed camera program and speed management generally

65
NSW Auditor-General’s report (2) Fixed cameras generally located in areas with high road safety risk May be other locations for mobile cameras with greater road safety risk than currently used Speed cameras change driver behaviour and have positive road safety impact overall Results from individual cameras varied – crashes decreased at some but not others Too early to tell impact of mobile and safety (intersection) cameras – introduced 2010 but early signs encouraging
 Fixed cameras generally located in areas with high road safety risk May be other locations for mobile cameras with greater road safety risk than currently used Speed cameras change driver behaviour and have positive road safety impact overall Results from individual cameras varied – crashes decreased at some but not others Too early to tell impact of mobile and safety (intersection) cameras – introduced 2010 but early signs encouraging")
66
NSW Auditor-General’s report (3) No evidence that camera sites were chosen based on potential revenue. Site selection based on road safety No incentives for private contractors to generate more offences (ie contractor payments do not relate to number of offences) Traffic authority, not contractor, decides site location, roster of enforcement hours, alternative deployment sites Not all camera locations consistent with site location criteria Annual review needed of all camera locations as part of overarching strategy.
 Traffic authority, not contractor, decides site location, roster of enforcement hours, alternative deployment sites Not all camera locations consistent with site location criteria Annual review needed of all camera locations as part of overarching strategy..")
67
NSW Auditor-General’s report (4) Need to annually monitor the effectiveness of each camera and publish trends in crashes, revenue, and speeding or infringement data for each camera Cameras do not change behaviour of high level speeders (ie >45km/hr over the limit) Less public concern about revenue raised by police speed enforcement (ie not cameras) yet they raise almost same amount of money
 Need to annually monitor the effectiveness of each camera and publish trends in crashes, revenue, and speeding or infringement data for each camera Cameras do not change behaviour of high level speeders (ie >45km/hr over the limit) Less public concern about revenue raised by police speed enforcement (ie not cameras) yet they raise almost same amount of money")
68
NSW Auditor-General’s report (5) 93 of 141 fixed camera locations effective with clear road safety benefits. Noted plan to review and relocate the remaining 38 cameras But, public ‘outrage’ at this possible removal saw some cameras retained Current situation.... Some cameras reactivated (not issuing fines) Small number removed Ongoing stakeholder consultation to determine future of the remaining questioned cameras
 Small number removed Ongoing stakeholder consultation to determine future of the remaining questioned cameras.")
69
Victorian Auditor-General’s report (1) ‘Sections of the community and media have shown significant interest in the road safety camera program, voicing concerns about whether using cameras is appropriate, the accuracy of cameras, and the validity of infringements. Some allege that the purpose of the road safety camera program is to raise revenue, while major faults such as those of the Western Ring Road fixed speed cameras in 2003 and the 9 incorrect fines issued on the Hume Freeway point-to-point cameras in 2010 have served to erode public confidence in the program’. 2011, p.vii

70
Victorian Auditor-General’s report (2) The Audit examined: – whether there is a sound rationale for the road safety camera program –whether the cameras are sited for road safety outcomes –the accuracy of the camera system, and –whether the public can be confident that an infringement is valid
 The Audit examined: – whether there is a sound rationale for the road safety camera program –whether the cameras are sited for road safety outcomes –the accuracy of the camera system, and –whether the public can be confident that an infringement is valid")
71
Victorian Auditor-General’s report (3) The supporting technology used and camera operations systems provide high degree of confidence that infringements are issued only when clear evidence of speeding or red-light running Processes and controls in place provide a particularly high level of confidence in reliability and integrity of road safety camera system
 The supporting technology used and camera operations systems provide high degree of confidence that infringements are issued only when clear evidence of speeding or red-light running Processes and controls in place provide a particularly high level of confidence in reliability and integrity of road safety camera system")
72
Victorian Auditor-General’s report (4) Revenue generation demonstrably not the primary purpose of camera program In fact, more revenue could be raised through tightening operational polices that provide for some leniency to speeding drivers Deployment and siting of fixed and mobile cameras based on road safety objectives
 Revenue generation demonstrably not the primary purpose of camera program In fact, more revenue could be raised through tightening operational polices that provide for some leniency to speeding drivers Deployment and siting of fixed and mobile cameras based on road safety objectives")
73
Victorian Auditor-General’s report (5) Further revisions (eg. random deployment of mobile cameras) should strengthen current program Cameras cannot identify a large proportion of speeding motorcyclists Need to address gap in enforcement for motorcyclists
 should strengthen current program Cameras cannot identify a large proportion of speeding motorcyclists Need to address gap in enforcement for motorcyclists.")
74
Victorian Auditor-General’s report (6) Suggest improvements to allay public perceptions about program integrity & purpose: –Ongoing systematic review and evaluation of fixed cameras on freeways –Program of independent testing of mobile cameras –Need for communication strategy and public education campaigns to specifically address widely held misconceptions of revenue raising and camera inaccuracy –Greater attention to promote positive contribution of road safety camera program in Victoria
 Suggest improvements to allay public perceptions about program integrity & purpose: –Ongoing systematic review and evaluation of fixed cameras on freeways –Program of independent testing of mobile cameras –Need for communication strategy and public education campaigns to specifically address widely held misconceptions of revenue raising and camera inaccuracy –Greater attention to promote positive contribution of road safety camera program in Victoria")
75
Speeding offenders... Are they all the same? Does increasing penalties make any difference? What else do they do? How do they perceive current penalties? What motivates non-compliance? Why don’t penalties make a difference to some offenders? What might best change their driving behaviour?

76
Speed management priorities (1) Reduce opportunities to avoid detection and punishment by: −identifying best mix of automatic and manned enforcement −developing strategies to reduce enforcement ‘site learning’ without compromising overall visibility −investigating individuals who accumulate large amount of demerit points (NSW) −developing better detection of speeding motorcyclists −implementing innovative strategies like point-to-point (average) enforcement which identifies persistent speeding over longer distances
 Reduce opportunities to avoid detection and punishment by: −identifying best mix of automatic and manned enforcement −developing strategies to reduce enforcement ‘site learning’ without compromising overall visibility −investigating individuals who accumulate large amount of demerit points (NSW) −developing better detection of speeding motorcyclists −implementing innovative strategies like point-to-point (average) enforcement which identifies persistent speeding over longer distances")
77
Speed management priorities (2) Implement and evaluate innovative sanctions for reducing speeding recidivism −vehicle impoundment −intelligent speed adaption (ISA) −behaviour change/rehabilitation programs
 Implement and evaluate innovative sanctions for reducing speeding recidivism −vehicle impoundment −intelligent speed adaption (ISA) −behaviour change/rehabilitation programs")
78
Speed management priorities (3) Innovative communication strategies needed to: −challenge perception that speeding is okay and that everyone speeds −address community perceptions of enforcement tolerances −challenge perception that low level speeding is safe −encourage voluntary use of ISA (private and fleet vehicles)
 Innovative communication strategies needed to: −challenge perception that speeding is okay and that everyone speeds −address community perceptions of enforcement tolerances −challenge perception that low level speeding is safe −encourage voluntary use of ISA (private and fleet vehicles)")
79
Speeding offenders... Are they all the same? Does increasing penalties make any difference? What else do they do? How do they perceive current penalties? What motivates non-compliance? Why don’t penalties make a difference to some offenders? What might best change their driving behaviour?........and many more questions yet to be answered.

80
Thank you, any questions? j.fleiter@qut.edu.au Mark your Diaries! International Council on Alcohol, Drugs and Traffic Safety Conference (ICADTS T2013) August 2013, Brisbane Convention and Exhibition Centre
 August 2013, Brisbane Convention and Exhibition Centre.")
81
References (1) Auditor-General New South Wales. (2011). Improving Road Safety: Speed Cameras, Road and Traffic Authority - New South Wales Auditor-General’s Report. Auditor-General Victoria (2011). Victorian Auditor-General’s Report: Road Safety Camera Program. Australian Transport Council. (2011). National Road Safety Strategy 2011-2020. Cameron, M. (2008). Development for strategies for best practice in speed enforcement in Western Australia –, Supplementary Report. Report 277. Melbourne: Monash University Accident Research Centre. Carnis, L., Rakotonirainy, A., & Fleiter, J. (2008) Speed enforcement programmes in France and Queensland: First elements for a systematic comparison. In High risk road users - motivating behaviour change: what works and what doesn't work? National Conference of the Australasian College of Road Safety and the Travelsafe Committee of the Queensland Parliament, 18-19 September 2008, Brisbane. Fleiter, J. J., Lennon, A., & Watson, B. (2007). Choosing not to speed: A qualitative exploration of differences in perceptions about speed limit compliance and related issues. Paper presented at the Australasian Road Safety Research Policing Education Conference, Melbourne, 17-19 October, Melbourne. Fleiter, J. J., Lennon, A., & Watson, B. (2010). How do other people influence your driving speed? Exploring the 'who' and the 'how' of social influences on speeding from a qualitative perspective. Transportation Research Part F: Traffic Psychology and Behaviour, 13, 49-62.
. Victorian Auditor-General’s Report: Road Safety Camera Program. Australian Transport Council. (2011). National Road Safety Strategy Cameron, M. (2008). Development for strategies for best practice in speed enforcement in Western Australia –, Supplementary Report. Report 277. Melbourne: Monash University Accident Research Centre. Carnis, L., Rakotonirainy, A., & Fleiter, J. (2008) Speed enforcement programmes in France and Queensland: First elements for a systematic comparison. In High risk road users - motivating behaviour change: what works and what doesn t work. National Conference of the Australasian College of Road Safety and the Travelsafe Committee of the Queensland Parliament, September 2008, Brisbane. Fleiter, J. J., Lennon, A., & Watson, B. (2007). Choosing not to speed: A qualitative exploration of differences in perceptions about speed limit compliance and related issues. Paper presented at the Australasian Road Safety Research Policing Education Conference, Melbourne, October, Melbourne. Fleiter, J. J., Lennon, A., & Watson, B. (2010). How do other people influence your driving speed. Exploring the who and the how of social influences on speeding from a qualitative perspective. Transportation Research Part F: Traffic Psychology and Behaviour, 13,")
82
References (2) Newstead, S. (2006). Evaluation of the crash effects of the Queensland speed camera program in the year 2005. Melbourne: Monash University Accident Research Centre. Petroulias, T. (2011). Community Attitudes to Road Safety – 2011 Survey Report. In Department of Infrastructure and Transport (Ed.). Canberra. Queensland TMR (2011). Queensland Road Toll Weekly Report No. 689. Year to date to Sunday 10 April 2011. Brisbane: Queensland Department of Transport & Main Roads. Watson, B., Watson, A., Siskind, V. & Fleiter, J. (2009). Characteristics and predictors of high-range speeding offences. Proceedings of the 2009 Australasian Road Safety Research, Policing and Education Conference. Sydney: Roads & Traffic Authority of NSW. Watson, B., Siskind, V., Fleiter, J. & Watson, A. (2010). Different approaches to measuring specific deterrence: some examples from speeding offender management. Proceedings of the 2010 Australasian Road Safety Research, Policing and Education Conference. Canberra: Department of Infrastructure, Transport, Regional Development & Local Government. World Health Organization (2004) World report on road traffic injury prevention. Geneva.
. Community Attitudes to Road Safety – 2011 Survey Report. In Department of Infrastructure and Transport (Ed.). Canberra. Queensland TMR (2011). Queensland Road Toll Weekly Report No Year to date to Sunday 10 April Brisbane: Queensland Department of Transport & Main Roads. Watson, B., Watson, A., Siskind, V. & Fleiter, J. (2009). Characteristics and predictors of high-range speeding offences. Proceedings of the 2009 Australasian Road Safety Research, Policing and Education Conference. Sydney: Roads & Traffic Authority of NSW. Watson, B., Siskind, V., Fleiter, J. & Watson, A. (2010). Different approaches to measuring specific deterrence: some examples from speeding offender management. Proceedings of the 2010 Australasian Road Safety Research, Policing and Education Conference. Canberra: Department of Infrastructure, Transport, Regional Development & Local Government. World Health Organization (2004) World report on road traffic injury prevention. Geneva..")
Similar presentations


 1.>")


 Improvements and benefits- the regulator’s perspective Stephen Turner Director, Bus Safety.>")


 2008 AGM.>")