Download presentation
Presentation is loading. Please wait.

1
Capital Budgeting Real Asset Valuation and Profitability –NPV –IRR –MIRR –Payback –Cross-over rates Capital Budgeting process –Cash flows that matter –WACC –Sensitivity analysis –Incorporating risk in capital budgeting

2
Real Asset Valuation Valuation Measuring Profitability –The good (NPV) –The bad (IRR) –Cross-over rate –The ugly (Payback) –MIRR
 –The bad (IRR) –Cross-over rate –The ugly (Payback) –MIRR")
3
Real Asset Valuation PV(asset)=PV(future cash flows from asset) 3 elements: –CF=cash flow –Maturity=n –Interest rate=R Average cost of money Cost of capital? What are the determinants of the firm’s value? What would the firm’s value be if it had a perpetual cash flow? Can the firm get value from other factors?

4
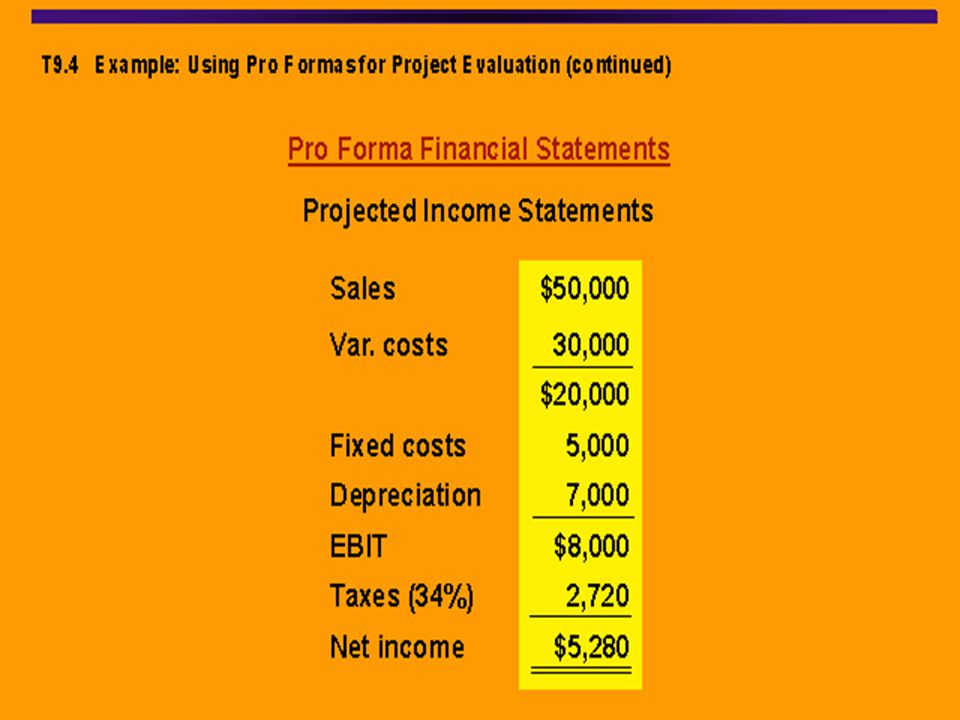
The good: Net Present Value Formula: Where I/O is the initial outlay It measures the $ profitability, taking into account time value of money and risk. It is often referred to as the “extra” $ available to the owners…any comments? It assumes that cash flows are reinvested at R.

5
NPV Calculation R=10% AB YearCFCF 0-350-250 150125 2100100 315075 420050

6
NPV Calculation For A: NPV(A)=27.4 For B: NPV(B)=36.78
=27.4 For B: NPV(B)=36.78")
7
The Bad: Internal rate of return IRR is the minimum return (yield) on a real investment so that the present value of the future cash flows is equal to the I/O--It is the (break- even) rate that sets NPV equal to zero. IRR=Additional cents on the $ invested It assumes that CFs are reinvested at IRR It might include several (irrelevant) solutions It might provide contradictory results with NPV
 solutions It might provide contradictory results with NPV.")
8
IRR Calculation R=10% ABA-B YearCFCFCF 0-350-250-100 150125-75 21001000 31507575 420050150 IRR12.91%17.80%8.1%???

10
NPV vs. IRR NPV and IRR will generally give us the same decision Exceptions –Non-conventional cash flows – cash flow signs change more than once –Mutually exclusive projects Initial investments are substantially different Timing of cash flows is substantially different

11
Another Example – Non- conventional Cash Flows Suppose an investment will cost $90,000 initially and will generate the following cash flows: –Year 1: 132,000 –Year 2: 100,000 –Year 3: -150,000 The required return is 15%. Should we accept or reject the project?

12
NPV Profile IRR = 10.11% and 42.66%

13
Summary of Decision Rules The NPV is positive at a required return of 15%, so you should Accept If you use the financial calculator, you would get an IRR of 10.11% which would tell you to Reject You need to recognize that there are non- conventional cash flows and look at the NPV profile

14
IRR and Mutually Exclusive Projects Mutually exclusive projects –If you choose one, you can’t choose the other –Example: You can choose to attend graduate school at either Harvard or Stanford, but not both Intuitively you would use the following decision rules: –NPV – choose the project with the higher NPV –IRR – choose the project with the higher IRR

15
Example With Mutually Exclusive Projects PeriodProject A Project B 0-500-400 1325 2 200 IRR19.43%22.17% NPV64.0560.74 The required return for both projects is 10%. Which project should you accept and why?

16
NPV Profiles IRR for A = 19.43% IRR for B = 22.17% Crossover Point = 11.8%

17
Conflicts Between NPV and IRR NPV directly measures the increase in value to the firm Whenever there is a conflict between NPV and another decision rule, you should always use NPV IRR is unreliable in the following situations –Non-conventional cash flows –Mutually exclusive projects

18
Summary – Discounted Cash Flow Criteria Net present value –Difference between market value and cost –Take the project if the NPV is positive –Has no serious problems –Preferred decision criterion Internal rate of return –Discount rate that makes NPV = 0 –Take the project if the IRR is greater than the required return –Same decision as NPV with conventional cash flows –IRR is unreliable with non-conventional cash flows or mutually exclusive projects Payback period –Length of time until initial investment is recovered –Take the project if it pays back within some specified period –Doesn’t account for time value of money and there is an arbitrary cutoff period

19
A Better Method: MIRR Assume that Cash Flows are reinvested at the opportunity cost rate. Bring all positive cash flows to the future=FV(Positive cash flows) Bring all negative cash flows to the present =PV(Negative cash flows) Then, FV(Positive cash flows)= PV(Negative cash flows) x FVIF (n, MIRR)
 Bring all negative cash flows to the present =PV(Negative cash flows) Then, FV(Positive cash flows)= PV(Negative cash flows) x FVIF (n, MIRR).")
20
Example: MIRR For Project A Do Project B… R=10% AB YearCFCF 0-350-250 150125 2100100 315075 420050

21
The Ugly: Payback Payback: length of time until the sum of an investment’s cash flows equals its cost. YearCFCumulated CF 1200200 2400600 36001200 I/O=$1,000 Payback=2 year + 400/600=2 2/3 year No time value No risk Focuses on liquidity; thus, biased against long term projects What is the most common measure of profitability in corporate America?

22
Payback Calculation R=10% AB YearCFCF 0-350-250 150125 2100100 315075 420050 Payback3.25 years2.33 years

23
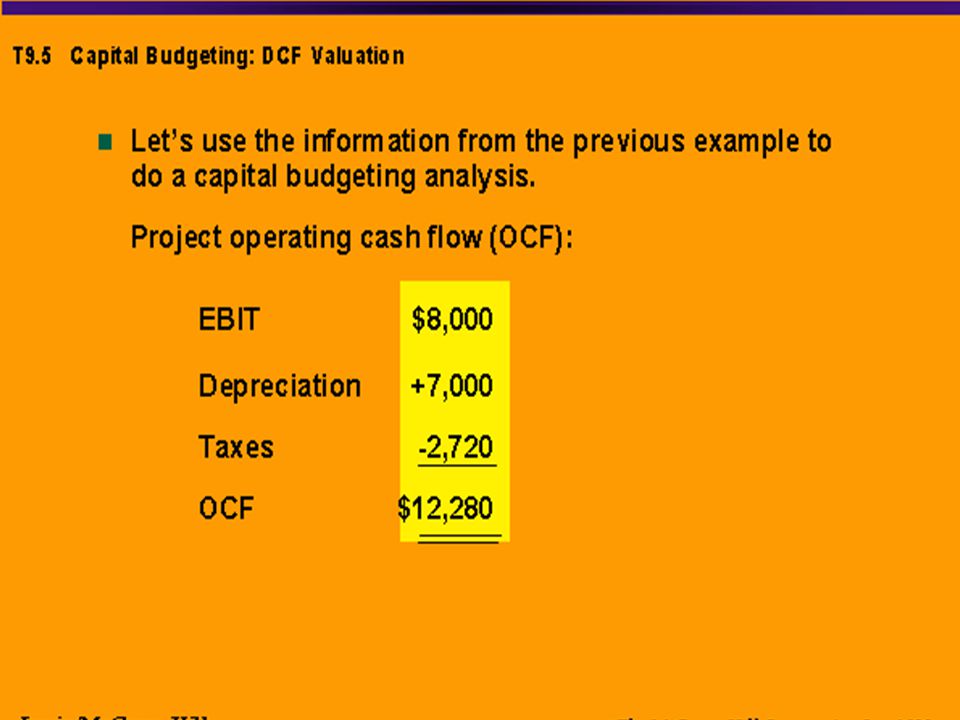
Capital Budgeting Capital budgeting –Cash flow Start form nothing=CFA Expand or Replace=ΔCFA –Cost of capital

24
Cash Flows That Matters... Stand-alone principle: Cash flow that matters in a new project: Cash flow from assets Cash flow that matters in a replacement or expansion project: Incremental Cash flow from assets Also,

25
Incremental Cash Flow Analysis (case of replacement or expansion Project) Δ revenues + Δ costs (“-” for an increase in costs, “+” for savings in costs) + Δ Depreciation (“+” for an increase in DPR, “-” for a decrease in DPR) + Δ taxes (“-” for an increase in taxes, “+” for savings in taxes) + Δ NWC sp. (“-” for an increase in NWC sp., “+” for a decrease in NWC sp.) + Δ Fixed Assets spending (“-” for an increase in FA sp., “+” for a decrease in FA sp.) --------------------------------------- Incremental (Δ )Cash flow from assets
 + Δ Fixed Assets spending ( - for an increase in FA sp., + for a decrease in FA sp.) Incremental (Δ )Cash flow from assets.")
26
Costs that matter…or not Sunk costs (R&D, consulting fee) Opportunity cost and externalities: cost of using a rented vs. own building space (opportunity cost: you could lease/rent it for a certain amount of dollar) NWC: it is recovered at the end (2 techniques) Terminal value (the value at the end…) Initial outlay Financing costs –Are they included in “cash flow from assets”? –Would you consider them in evaluating the profitability of a project? Why? How?
 NWC: it is recovered at the end (2 techniques) Terminal value (the value at the end…) Initial outlay Financing costs –Are they included in cash flow from assets . –Would you consider them in evaluating the profitability of a project. Why. How .")
32
More Complicated Case: REPLACEMENT PROJECT Ex: you are looking at replacing an old processing system with a new one. Installation costs of the new system (net of taxes) are $485,000, which is going to be depreciated to zero over five years. The new system can be scrapped for $60,000. The pre-tax operating cost savings are $100,000 per year. also, the new system requires an initial net working capital injection of $50,000. The tax rate is approximately 34%. The discount rate for this project is 15%. Go or no-go with the replacement?
 are $485,000, which is going to be depreciated to zero over five years. The new system can be scrapped for $60,000. The pre-tax operating cost savings are $100,000 per year. also, the new system requires an initial net working capital injection of $50,000. The tax rate is approximately 34%. The discount rate for this project is 15%. Go or no-go with the replacement .")
33
An other replacement Problem Original Machine –Initial cost = 100,000 –Annual depreciation = 9000 –Purchased 5 years ago –Book Value = 55,000 –Salvage today = 65,000 –Salvage in 5 years = 10,000 New Machine –Initial cost = 150,000 –5-year life –Salvage in 5 years = 0 –Cost savings = 50,000 per year –3-year MACRS depreciation Required return = 10% Tax rate = 40%

34
Cost Cutting… Your company is considering a new computer system that will initially cost $1 million. It will save $300,000 a year in inventory and receivables management costs. The system is expected to last for five years and will be depreciated using 3- year MACRS. The system is expected to have a salvage value of $50,000 at the end of year 5. There is no impact on net working capital. The marginal tax rate is 40%. The required return is 8%.

35
More Complicated Case: EXPANSION PROJECT Ex: HEP a tech company is looking at a full scale production of its “atomic filtration” device (AFD). The marketing department estimates that an additional 15,000 units can be sold at $2,000 a piece. Additional Equipment needed would cost $9.5 million and $0.5 million in installation. This equipment can be depreciated straight line in 5 years to zero. Initial net working capital injection is $4 million. The life of the project is 4 years at the end of which it can be sold for $2 million. Variable cost are not changing from prior the expansion— i.e., 60% of sales. However, fixed costs will increase at least by $5 million a year. The marginal tax rate is approximately 40%. The discount rate for this project is 15%. Go or no-go with the expansion?

36
Sensitivity Analysis/ Simulation A probability function for NPV Simulation Value at risk? Sensitivity analysis What variables really matter? Crystal ball example Real Options

Similar presentations