Download presentation
Presentation is loading. Please wait.

1
The scheduling and timing of (food) shopping journeys: implications for transport energy demand Jillian Anable & Giulio Mattioli Centre for Transport Research, University of Aberdeen
 shopping journeys: implications for transport energy demand Jillian Anable & Giulio Mattioli Centre for Transport Research, University of Aberdeen")
2
The ‘taming of the few’ (Brand & Boardman, 2008; Brand & Preston, 2010) «Policy needs to target the gross polluters, i.e. certain subgroups of the population who are responsible for a disproportionally large share of total emissions. Policy has to seek out these differences, identify the causes and target these causes directly» (Brand & Boardman, 2008, p.234) Own survey (Oxfordshire, 2005, N=456 individuals), methodology for profiling annual GHG emissions from personal travel at the disaggregate level Air and car travel dominate GHG emissions. Public transport insignificant overall ‘60-20 rule’ in unequal distribution of transport-related GHG emissions: 60% of emissions produced by 20% of the population. Valid across units & scale of analysis Emission levels significantly influenced by socio-demographic factors (income, activity, age, household structure & car availiability) However «need for an alternative or complimentary segmentation»
 Own survey (Oxfordshire, 2005, N=456 individuals), methodology for profiling annual GHG emissions from personal travel at the disaggregate level Air and car travel dominate GHG emissions. Public transport insignificant overall ‘60-20 rule’ in unequal distribution of transport-related GHG emissions: 60% of emissions produced by 20% of the population. Valid across units & scale of analysis Emission levels significantly influenced by socio-demographic factors (income, activity, age, household structure & car availiability) However «need for an alternative or complimentary segmentation».")
3
Our approach Focus on ‘what people do’ / ‘what energy is for’ (Shove & Walker, 2014). Specific practice: food shopping Use NTS 2002-2010 travel week diary data at the household level Focus on top 20% of weekly household car driver distance within different types of area (control for built environment effect) Estimate CO 2 emissions (2010 DECC’s GHG Conversion Factors) Move beyond averages, look for variety within the top 20%. Cluster households according to their weekly food shopping travel behaviour Focus on frequency / timing of food shopping travel (cfr. Walker, 2014)
 Estimate CO 2 emissions (2010 DECC’s GHG Conversion Factors) Move beyond averages, look for variety within the top 20%. Cluster households according to their weekly food shopping travel behaviour Focus on frequency / timing of food shopping travel (cfr. Walker, 2014).")
4
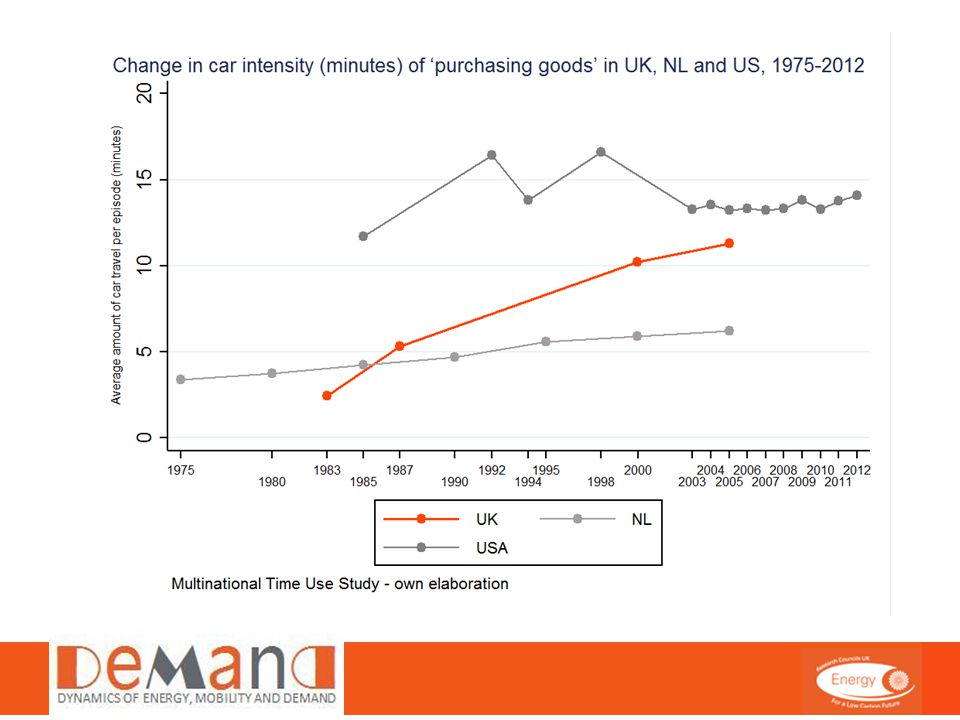
Why food shopping? It accounts for a substantial amount of travel (shopping = 20% of trips – 32% on Saturday! - 48% of these are for food) and CO 2 emissions (shopping = 12% of travel-related CO 2 emissions, 37% of these are for food shopping) It has become more car intensive over time in the UK: from 2 to 12 minutes of car travel for each episode of ‘purchase of goods’ between 1983 and 2005 (MTUS data analysis). This increase is: stronger than for other activities virtually absent in other countries (NL, USA) in the same period It is a frequent activity (94% at least once every 7 days, Bhat et al., 2004) enables to use the NTS 7-day travel diary to profile households based on their food shopping travel behaviour + estimate CO 2 emissions
 and CO 2 emissions (shopping = 12% of travel-related CO 2 emissions, 37% of these are for food shopping) It has become more car intensive over time in the UK: from 2 to 12 minutes of car travel for each episode of ‘purchase of goods’ between 1983 and 2005 (MTUS data analysis). This increase is: stronger than for other activities virtually absent in other countries (NL, USA) in the same period It is a frequent activity (94% at least once every 7 days, Bhat et al., 2004) enables to use the NTS 7-day travel diary to profile households based on their food shopping travel behaviour + estimate CO 2 emissions.")
7
Top 20% analyis subsample

9
70.4%

10
64.1%

12
Clustering Input variables 1DistancePercentile of car driver distance travelled (within type of area) 2Concentration% of distance accounted for by longest trip 3FrequencyTotal number of car driver trips in travel week diary 4Alternative modes% of trips by modes other than car driver / passenger 5Shopping intensity (distance)% of total household car driver distance accounted for by food shopping 6Shopping intensity (time)% of total household travel time accounted for by food shopping
 2Concentration% of distance accounted for by longest trip 3FrequencyTotal number of car driver trips in travel week diary 4Alternative modes% of trips by modes other than car driver / passenger 5Shopping intensity (distance)% of total household car driver distance accounted for by food shopping 6Shopping intensity (time)% of total household travel time accounted for by food shopping")
13
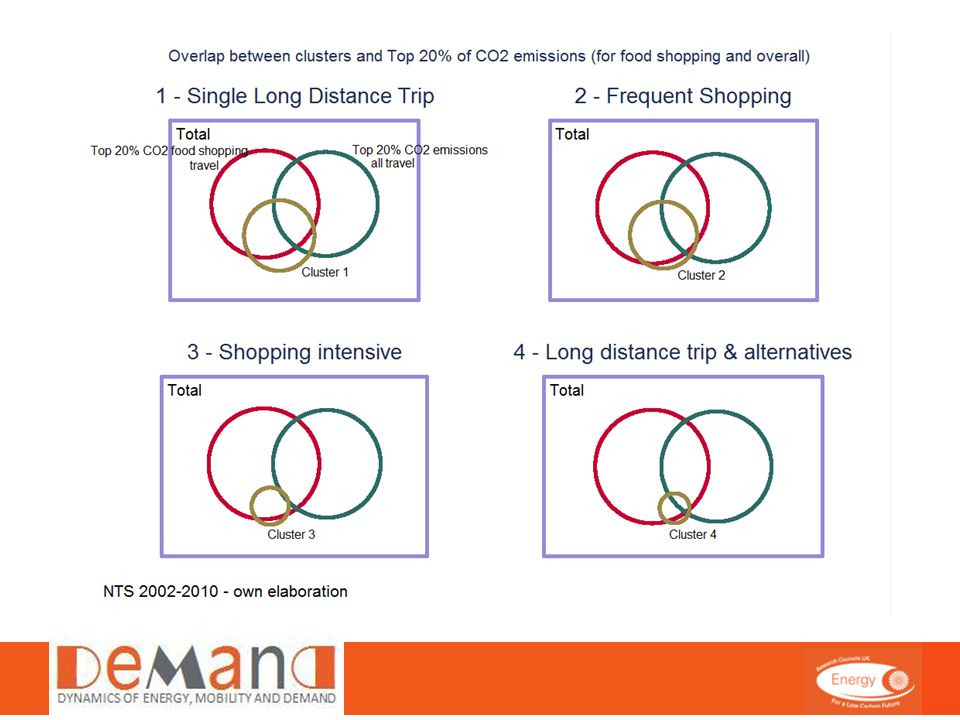
4 cluster solution Single long distance trip Frequent shopping Shopping intensive week Long distance trip & alternatives Cluster 1Cluster 2Cluster 3Cluster 4 Size (%)44.9%37.1%11.7%7.3% Distance (percentile)3664 43 Concentration50%28%34%49% Frequency3.36.85.53.3 Alternatives0.4%1.3%2.3%40.3% Shopping intensity – distance12%16%57%17% Shopping intensity – travel time9%13%43%16%
44.9%37.1%11.7%7.3% Distance (percentile) Concentration50%28%34%49% Frequency Alternatives0.4%1.3%2.3%40.3% Shopping intensity – distance12%16%57%17% Shopping intensity – travel time9%13%43%16%")
14
4 cluster solution Single long distance trip Frequent shopping Shopping intensive Long distance trip & alternatives Cluster 1Cluster 2Cluster 3Cluster 4 Size (%)44.9%37.1%11.7%7.3% Distance (percentile)3664 43 Concentration50%28%34%49% Frequency3.36.85.53.3 Alternatives0.4%1.3%2.3%40.3% Shopping intensity – distance12%16%57%17% Shopping intensity – travel time9%13%43%16%
44.9%37.1%11.7%7.3% Distance (percentile) Concentration50%28%34%49% Frequency Alternatives0.4%1.3%2.3%40.3% Shopping intensity – distance12%16%57%17% Shopping intensity – travel time9%13%43%16%")
15
Socio-demographic profile

23
Conclusion – policy implications Frequency (not just distance) as a problem. Concentration of trips and/or substitution with online shopping as policy goals? ‘Gross polluters’ need to be targeted, but within this need to look for ‘quick wins’: Cluster 3 might be the most susceptible for substitution of some trips by home shopping or more local trips or non-car modes No strong impact of accessibility: built environment matters, but it is only part of the story CLUSTER 3: SHOPPING INTENSIVE mostly pensioner, poorer and smaller households......but very car reliant for food shopping the most travel– and carbon– intensive travel patterns, mostly due to high frequency…...but not gross polluters overall fast-growing segment due to ageing car mobile population challenge for equitable policies

24
Thank you for your attention! www.demand.ac.uk j.anable@abdn.ac.uk giulio.mattioli@abdn.ac.uk

Similar presentations


 © Prof. K. Zografos STEPs STEPs Scenarios for the.>")


 80% Married or defacto 40% own home with a mortgage 30,000 are Self Employed 50% work Full Time 31% have HH.>")


