Download presentation
Presentation is loading. Please wait.

1
THE COLLATERAL HEALTH IMPACT OF SARS IN TAIWAN Daniel Bennett (University of Chicago) Chun-Fang Chiang (National Taiwan University) David Meltzer (University of Chicago) June 29, 2012
 Chun-Fang Chiang (National Taiwan University) David Meltzer (University of Chicago) June 29, 2012")
2
Introduction The SARS epidemic in 2003 lasted for 3 months and led to 312 confirmed cases and 82 deaths in Taiwan. However, the health impact of the SARS epidemic is not limited to people infected with SARS. Huge decline in both outpatient visits and inpatient visits. Any consequences of these missing visits?

3
Introduction How many non-SARS deaths did SARS cause? Which groups experienced greater mortality? Any long run health impact due to missing hospital visits?

4
Context National Health Insurance in Taiwan -- high coverage rate (96%) -- low copayments -- frequent hospital visits SARS 2003 in Taiwan -- first case : 3/15 -- first big event: 4/23 -- first death case: 5/1 -- removed on WHO list : 7/ 3
 -- low copayments -- frequent hospital visits SARS 2003 in Taiwan -- first case : 3/15 -- first big event: 4/23 -- first death case: 5/1 -- removed on WHO list : 7/ 3")
5
Implications Health impact due to panic/fear caused by infectious disease Welfare analysis of health care system. ( If fewer visits do not worsen health, then health care services may be wasteful: shopping and and unnecessary visits )
.")
6
Literature— Medical Care Utilization and Mortality Less utilization higher mortality -- Card, Dobkin and Maestas (2009) Medicare eligibility (65 years old); Sample: around age 65, admitted to hospitals through emergency departments nearly 1-percentage-point drop in 7-day mortality for patients -- Ken Chay (2012) Canada data -- Some studies find no effect: -- Finkelstein and McKnight(2008). Medicare in 1965-1975 -- Generous insurance coverage : no effect Most studies find some effects. Freeman (2008)
.")
7
Literature— Changes during/after the SARS epidemic Decline in outpatient and inpatient hospital visits Admission rates for most chronic ambulatory-care sensitive conditions (ACS), except for diabetes, did not change after the SARS epidemic. (Huang, Lee and Hsiao) Shifting childbirth services from advanced hospitals to local community hospitals during SARS epidemic did not increase neonatal mortality
 Shifting childbirth services from advanced hospitals to local community hospitals during SARS epidemic did not increase neonatal mortality.")
8
Data Population death records -- month of death, age, cause of death, township BNHI panel of one million people -- outpatient and inpatient records ICD9 code, expenditure -- birthday, sex -- linked with death records (month of death) -- use the date out of the insurance in the same month to identify the date of death
 -- use the date out of the insurance in the same month to identify the date of death")
9
The 2003 SARS Epidemic in Taiwan

10
Outpatient Visits: Ratio of 2003 to Other Years by Month

11
Inpatient Visits: Ratio of 2003 to Other Years by Month

12
Mortality: 2003 and 2000-2002

13
Mortality (age>=65)
")
14
Mortality (age<65)
")
15
Alternative Explanations Economic Shocks -- unemployment rate didn’t increase -- less activity less mortality (Evans and Moore 2009) Psychological shocks -- compare the pattern and changes in mortality after SARS with these after 921 earthquake
 Psychological shocks -- compare the pattern and changes in mortality after SARS with these after 921 earthquake")
16
Psychological shocks 921 Earthquake happened on Sep, 21 in 1999. Number of deaths: 2415 Mortality from diseases, however, did not increase

17
Mortality for all causes of death 2003 v.s. 2000-2002avg v.s. 1999

18
Mortality (disease or natural death)
")
19
Analysis using Population Death Data Sample: Monthly mortality from 1999 to 2008 Specification: Include month fixed effects & year fixed effects to estimate the changes in mortality

20
Table 1: Changes in Mortality during 2003 SARS period Dependent variable:Non-SARS Mortality ( by thousand) Category:AllOLDYoung (1) (2)(3) March 2003 -0.00510.0020-0.0054 (0.0187)(0.1401)(0.0089) April 2003 0.0061 0.02740.0037 (0.0187) (0.1401)(0.0089) May 2003 0.0455**0.4053***0.0088 (0.0187)(0.1401)(0.0089) June 2003 0.00960.02750.0074 (0.0187)(0.1401)(0.0089) July2003 0.00590.01090.0056 (0.0187)(0.1401) (0.0089) Month fixed effectsYes Year fixed effectsYes R-squared0.81 0.820.37
 Category:AllOLDYoung (1) (2)(3) March (0.0187)(0.1401)(0.0089) April (0.0187) (0.1401)(0.0089) May **0.4053*** (0.0187)(0.1401)(0.0089) June (0.0187)(0.1401)(0.0089) July (0.0187)(0.1401) (0.0089) Month fixed effectsYes Year fixed effectsYes R-squared")
21
Analysis using Population Death Data From column (1), 1042 non-SARS extra deaths in May 2003 (Population 2003: 22,604,548; 129,878 dead) From column (2), 842 non-SARS extra deaths among old people in May 2003 (Pop: 2,087,718, 85,778 dead ) SARS death cases: 82
, 1042 non-SARS extra deaths in May 2003 (Population 2003: 22,604,548; 129,878 dead) From column (2), 842 non-SARS extra deaths among old people in May 2003 (Pop: 2,087,718, 85,778 dead ) SARS death cases: 82")
22
Analysis using NHI one million panel If missing inpatient hospital visits were responsible for more deaths, we should observe that more deaths from people with higher medical demand. Time series analysis by group (first look) Survival analysis using individual data
 Survival analysis using individual data.")
23
Analysis I Group 1: High Medical Demand: # Hospital visits > 11 or hospital stay > 7 days in 2002 Group 2: Low Medical Demand: Sample: Mortality by week and group starting from 2003

24
Table 2: Mortality by history of hospital visits Dependent variable:Mortality ( t ) Category:OldYoungGroup H Group L (1)(2)(3) (4) Week9*20030.049-0.0040.027 -0.0181 Week10*2003-0.021-0.0080.012 -0.041 Week11*20030.135-0.0060.048 -0.001 Week12*20030.154*0.0250.061* 0.01 Week13*20030.162*-0.0000.077** -0.017 Week14*20030.160*-0.0110.010 0.026 Week15*20030.008-0.0090.038 -0.049 Week16*20030.0080.01870.056* 0.039 Week17*20030.053-0.0060.050 -0.004 Week18*20030.0320.0010.018 0.01 Week19*20030.183**0.0080.098** 0.011 Week20*20030.0490.0090.017 -0.001 Week21*20030.191**-0.0070.055* 0.043 Week22*20030.1080.0110.046 0.011 Week23*20030.011-0.0010.005 0.012 Week24*20030.021-0.002-0.003 -0.008 Week25*20030.034-0.0020.034 -0.017 Week26*2003-0.0510.0090.025 -0.015 Sample size360 240 R-squared
 Category:OldYoungGroup H Group L (1)(2)(3) (4) Week9* Week10* Week11* Week12* * * 0.01 Week13* * ** Week14* * Week15* Week16* * Week17* Week18* Week19* ** ** Week20* Week21* ** * Week22* Week23* Week24* Week25* Week26* Sample size R-squared")
27
Change in mortality by disease Cancer v.s. Diabetes

28
Findings regarding short run effects While 82 people died of SARS in Taiwan, we find that the epidemic is associated with around 1000 additional non-SARS deaths. The health impact is larger among the elderly and those with higher medical demand than others. Differential effects by disease

29
Did missing visits cause any long term impacts? Conditional on being alive after SARS, we would like to estimate the long term impacts of missing visits. Empirical difficulty: One’s hospital visiting frequency is related with one’s health condition. Those who has decreasing visits could be getting healthier.

30
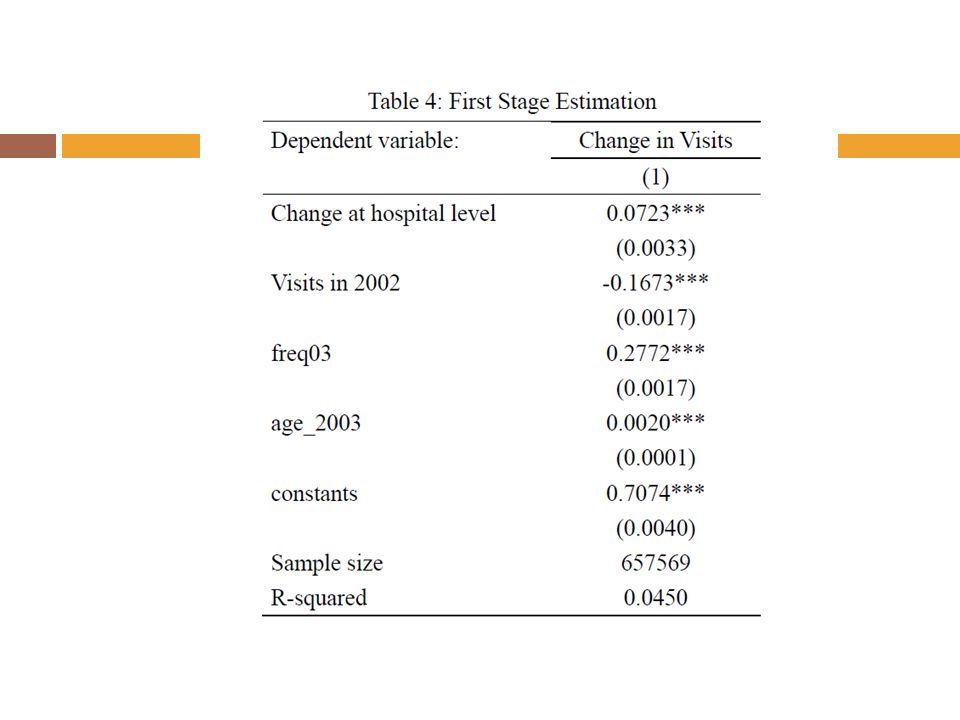
Did missing visits cause any long term impacts? Empirical Strategy: Using instrument variable: Changes in hospital visits of the patient’s hospital Sample: one million panel Those who had at least one hospital visit from 2003/1 -2003/3 & survived the Sars epidemic

31
Specification I

34
Specification II

35
Effects by disease Some preliminary findings: -- The long run pattern is different from the pattern of short run effects -- larger impacts on cancer patients, and smaller impacts on diabetes patients. -- The impacts was smaller in later years

36
Conclusions We find that SARS epidemic causes more non-SARS deaths than SARS deaths during the SARS epidemic. We also find that missing hospital visits had long term impacts on those who avoid hospital visits.

Similar presentations


 Lee Feb. 9 th, 2007.>")


