Download presentation
Presentation is loading. Please wait.

1
Mam Ibraheem, MD, MPH Epidemic Intelligence Service Officer Centers for Disease Control and Prevention 2012 CSTE Annual Conference June 5, 2012 Visual Impairment Among Adults Aged ≥40 Years — New Mexico, 2008 Office of Surveillance, Epidemiology, and Laboratory Services Scientific Education and Professional Development Program Office

2
Vision Loss : A Public Health Problem Affects a lot of people 21 million have vision problems 80 million have potentially blinding diseases Contributes large burden Morbidity: depression, diabetes, hearing impairment, stroke, falls, cognitive decline, and premature death Quality of life: inability to drive, read, keep accounts, and travel Cost: estimated to exceed $51 billion

3
Vision Loss : A Public Health Problem Recently increased and will increase in future Rapidly aging U.S. population and increasing epidemics of diabetes Blindness and visual impairment (VI) double by 2030 Perceived threat by public Vision loss ranks among top ten causes of disability in United States Feasible to act on at community or public health level Early detection and treatment can prevent much blindness and vision impairment Vision screening among adults aged ≥ 65 years: one of top 10 priorities among effective clinical preventive services
 double by 2030 Perceived threat by public Vision loss ranks among top ten causes of disability in United States Feasible to act on at community or public health level Early detection and treatment can prevent much blindness and vision impairment Vision screening among adults aged ≥ 65 years: one of top 10 priorities among effective clinical preventive services.")
4
National Response Healthy People 2010 : Chapter 28 Vision Objectives National goal to "improve the visual and hearing health of the nation through prevention, early detection, treatment, and rehabilitation“ National Eye Institute: lead agency for vision objectives 10 vision objectives CDC’s Vision Health Initiative (VHI) Creates multilevel network for vision loss prevention and eye health promotion Serves on the Healthy People 2020 Vision Work Group May: Healthy Vision Month
 Creates multilevel network for vision loss prevention and eye health promotion Serves on the Healthy People 2020 Vision Work Group May: Healthy Vision Month")
5
Common Eye Disorders Among Adults Aged ≥40 Years Cataracts Glaucoma Diabetic Retinopathy Macular Degeneration

6
Vision Loss : At-Risk Populations Hispanics and African Americans Increased risk for glaucoma and diabetes complications Unaddressed cataract Older people at risk for age-related eye disease Diabetics Economically disadvantaged & socially isolated communities Lack culturally relevant information and limited access to heath care Rural communities lack education and limited health care access Persons with modifiable risk factors?

7
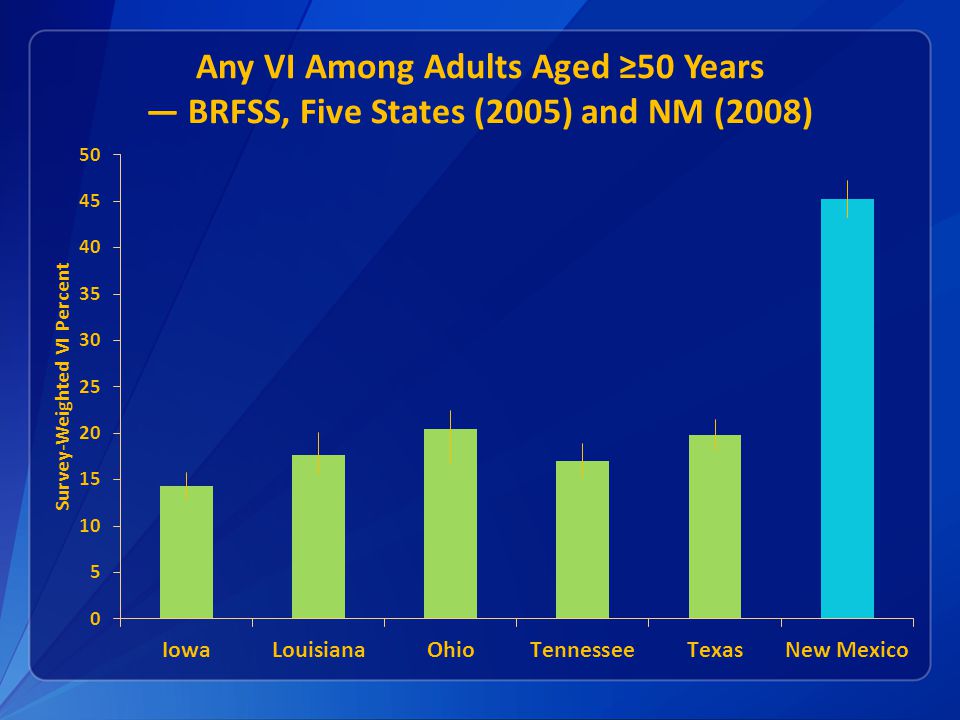
Behavioral Risk Factor Surveillance System (BRFSS) Vision Surveillance Optional “Visual Impairment and Access to Eye Care” module First implemented in five states (Ohio, Texas, Louisiana, Iowa and Tennessee) in 2005 Individuals aged ≥40 years 9 questions assess prevalence of self-reported Visual impairment Eye disease Eye examination Implemented in NM in 2008 Access to eye care Lack of eye care insurance
 Vision Surveillance Optional Visual Impairment and Access to Eye Care module First implemented in five states (Ohio, Texas, Louisiana, Iowa and Tennessee) in 2005 Individuals aged ≥40 years 9 questions assess prevalence of self-reported Visual impairment Eye disease Eye examination Implemented in NM in 2008 Access to eye care Lack of eye care insurance")
9
Study Objectives Estimate overall visual impairment (VI) prevalence in NM Estimate VI prevalence by race/ethnicity Assess association between race/ethnicity and VI Assess covariates and identify populations most at risk for vision loss to guide prevention strategies
 prevalence in NM Estimate VI prevalence by race/ethnicity Assess association between race/ethnicity and VI Assess covariates and identify populations most at risk for vision loss to guide prevention strategies")
10
Methods 2008 BRFSS data for 4,743 New Mexico adults aged ≥40 years BRFSS: complex cross-sectional survey Far vision: “How much difficulty, if any, do you have in recognizing a friend across the street?” Near vision: “How much difficulty, if any, do you have reading print in newspaper, magazine, recipe, menu, or numbers on the telephone?” While wearing glasses or contact lenses, for those who wore them

11
Main Outcome: Two VI Case Definitions No Difficulty A little difficulty Moderate difficulty Extreme difficulty Unable to do so because of eye sight 1. Broad: Any VI 2. Narrow: Moderate/Extreme VI Only Far or Near Vision Question

12
Main Exposure and Covariates Main Exposure: race/ethnicity Non-Hispanic white Hispanic American Indian or Alaska Native (AI/AN) Other, non-Hispanic Covariates Demographics Socioeconomic status General health/comorbidity Access to general health care or eye care Lifestyle
 Other, non-Hispanic Covariates Demographics Socioeconomic status General health/comorbidity Access to general health care or eye care Lifestyle")
13
Bivariate Analytic Methods Survey-weighted percentages P values associated with Pearson x 2 P value <0.05 statistically significant relationship Data analyzed using STATA® 12

14
Overall White, non-Hispanic Hispanic AI/AN Broad (Any VI) Narrow (Moderate/Extreme VI Only)
 Narrow (Moderate/Extreme VI Only)")
15
Visual Impairment Prevalence by Demographics Characteristic Sample Size Any VIModerate/Extreme VI %95% CIP value%95% CIP value Total474344.943.1–46.820.419.0–21.9 Race/Ethnicity47040.00 White, non-Hispanic289040.538.3–42.917.215.5–19.1 Hispanic137952.348.9–55.726.523.7–29.4 AI/AN25751.643.2–59.926.719.7–35.2 Sex47430.030.08 Male183342.739.8–45.719.016.8–21.4 Female291046.944.6–49.221.619.8–23.5 Age groups (yrs)47300.00 40–64302646.744.4–49.021.319.5–23.2 ≥65170440.637.8–43.418.316.2–20.6
 – – –23.2 ≥ – –20.6")
16
Visual Impairment Prevalence by Demographics Characteristic Sample Size Any VIModerate/Extreme VI %95% CIP value%95% CIP value Total474344.943.1–46.820.419.0–21.9 Race/Ethnicity47040.00 White, non-Hispanic289040.538.3–42.917.215.5–19.1 Hispanic137952.348.9–55.726.523.7–29.4 AI/AN25751.643.2–59.926.719.7–35.2 Sex47430.030.08 Male183342.739.8–45.719.016.8–21.4 Female291046.944.6–49.221.619.8–23.5 Age groups (yrs)47300.00 40–64302646.744.4–49.021.319.5–23.2 ≥65170440.637.8–43.418.316.2–20.6
 – – –23.2 ≥ – –20.6")
17
Visual Impairment Prevalence by Demographics Characteristic Sample Size Any VIModerate/Extreme VI %95% CIP value%95% CIP value Total474344.943.1–46.820.419.0–21.9 Race/Ethnicity47040.00 White, non-Hispanic289040.538.3–42.917.215.5–19.1 Hispanic137952.348.9–55.726.523.7–29.4 AI/AN25751.643.2–59.926.719.7–35.2 Sex47430.030.08 Male183342.739.8–45.719.016.8–21.4 Female291046.944.6–49.221.619.8–23.5 Age groups (yrs)47300.00 40–64302646.744.4–49.021.319.5–23.2 ≥65170440.637.8–43.418.316.2–20.6
 – – –23.2 ≥ – –20.6")
18
VI Prevalence by Socioeconomic Characteristics Characteristic Sample Size Any VI Moderate/Extreme VI %95% CIP% P Employment status47380.00 Employed234343.540.9–46.117.615.7–19.6 Unemployed15664.553.9–73.937.127.3–48.0 Education Level47380.00 Less than high school59857.151.8–62.234.029.1–39.2 High school graduate123351.848.1–55.523.320.5–26.4 Attended college/technical school122544.040.5–47.620.517.8–23.4 College/technical school graduate168236.733.8–39.713.811.8–16.0 Annual Household Income42530.00 <$15,00058661.055.7–66.037.832.7–43.2 $15,000–$24,99983051.546.9–56.224.020.4–28.1 $25,000–$34,99955749.043.5–54.523.018.6–28.1 $35,000–$49,99963147.542.6–52.421.617.9–25.8 ≥$50,000164937.134.2–40.113.811.9–15.9

19
VI Prevalence by Socioeconomic Characteristics Characteristic Sample Size Any VI Moderate/Extreme VI %95% CIP% P Employment status47380.00 Employed234343.540.9–46.117.615.7–19.6 Unemployed15664.553.9–73.937.127.3–48.0 Education Level47380.00 Less than high school59857.151.8–62.234.029.1–39.2 High school graduate123351.848.1–55.523.320.5–26.4 Attended college/technical school122544.040.5–47.620.517.8–23.4 College/technical school graduate168236.733.8–39.713.811.8–16.0 Annual Household Income42530.00 <$15,00058661.055.7–66.037.832.7–43.2 $15,000–$24,99983051.546.9–56.224.020.4–28.1 $25,000–$34,99955749.043.5–54.523.018.6–28.1 $35,000–$49,99963147.542.6–52.421.617.9–25.8 ≥$50,000164937.134.2–40.113.811.9–15.9

20
VI Prevalence by Socioeconomic Characteristics Characteristic Sample Size Any VI Moderate/Extreme VI %95% CIP% P Employment status47380.00 Employed234343.540.9–46.117.615.7–19.6 Unemployed15664.553.9–73.937.127.3–48.0 Education Level47380.00 Less than high school59857.151.8–62.234.029.1–39.2 High school graduate123351.848.1–55.523.320.5–26.4 Attended college/technical school122544.040.5–47.620.517.8–23.4 College/technical school graduate168236.733.8–39.713.811.8–16.0 Annual Household Income42530.00 <$15,00058661.055.7–66.037.832.7–43.2 $15,000–$24,99983051.546.9–56.224.020.4–28.1 $25,000–$34,99955749.043.5–54.523.018.6–28.1 $35,000–$49,99963147.542.6–52.421.617.9–25.8 ≥$50,000164937.134.2–40.113.811.9–15.9

21
VI Prevalence by Socioeconomic Characteristics Characteristic Sample Size Any VI Moderate/Extreme VI %95% CIP% P Employment status47380.00 Employed234343.540.9–46.117.615.7–19.6 Unemployed15664.553.9–73.937.127.3–48.0 Education Level47380.00 Less than high school59857.151.8–62.234.029.1–39.2 High school graduate123351.848.1–55.523.320.5–26.4 Attended college/technical school122544.040.5–47.620.517.8–23.4 College/technical school graduate168236.733.8–39.713.811.8–16.0 Annual Household Income42530.00 <$15,00058661.055.7–66.037.832.7–43.2 $15,000–$24,99983051.546.9–56.224.020.4–28.1 $25,000–$34,99955749.043.5–54.523.018.6–28.1 $35,000–$49,99963147.542.6–52.421.617.9–25.8 ≥$50,000164937.134.2–40.113.811.9–15.9

22
VI Prevalence by General Health and Comorbidities Characteristic Sample Size Any VI Moderate/Extreme VI %95% CIP% P Adults with “good” or better health47300.00 “Good” or better health360241.039.0–43.116.515.0–18.1 “Fair” or “poor” health112858.454.5–62.133.930.4–37.5 Ever diagnosed with a stroke47320.000.01 Yes20060.151.4–68.125.221.0–29.9 No453244.342.4–46.119.618.1–21.2 Ever told by Dr. you have diabetes46370.00 Yes59752.146.7–57.437.929.5–47.0 No404043.941.9–45.919.618.2–21.1

23
VI Prevalence by General Health and Comorbidities Characteristic Sample Size Any VI Moderate/Extreme VI %95% CIP% P Adults with “good” or better health47300.00 “Good” or better health360241.039.0–43.116.515.0–18.1 “Fair” or “poor” health112858.454.5–62.133.930.4–37.5 Ever diagnosed with a stroke47320.000.01 Yes20060.151.4–68.125.221.0–29.9 No453244.342.4–46.119.618.1–21.2 Ever told by Dr. you have diabetes46370.00 Yes59752.146.7–57.437.929.5–47.0 No404043.941.9–45.919.618.2–21.1

24
VI Prevalence by General Health and Comorbidities Characteristic Sample Size Any VI Moderate/Extreme VI %95% CIP% P Adults with “good” or better health47300.00 “Good” or better health360241.039.0–43.116.515.0–18.1 “Fair” or “poor” health112858.454.5–62.133.930.4–37.5 Ever diagnosed with a stroke47320.000.01 Yes20060.151.4–68.125.221.0–29.9 No453244.342.4–46.119.618.1–21.2 Ever told by Dr. you have diabetes46370.00 Yes59752.146.7–57.437.929.5–47.0 No404043.941.9–45.919.618.2–21.1

25
VI Prevalence by General Health and Comorbidities Characteristic Sample Size Any VI Moderate/Extreme VI %95% CIP% P Adults with “good” or better health47300.00 “Good” or better health360241.039.0–43.116.515.0–18.1 “Fair” or “poor” health112858.454.5–62.133.930.4–37.5 Ever diagnosed with a stroke47320.000.01 Yes20060.151.4–68.125.221.0–29.9 No453244.342.4–46.119.618.1–21.2 Ever told by Dr. you have diabetes46370.00 Yes59752.146.7–57.437.929.5–47.0 No404043.941.9–45.919.618.2–21.1

26
VI Prevalence by Access to General Health or Eye Care Characteristic Sample Size Any VIModerate/Extreme VI %95% CIP% P Have any health care coverage47380.00 Yes415943.641.7–45.619.317.8–20.8 No57953.648.1–59.128.023.5–33.0 Could not see Dr. because of cost47380.00 Yes63961.656.3–66.536.731.8–41.8 No409942.240.2–44.117.716.3–19.2 Last time visited eye care provider47100.00 <1m51938.633.2–44.316.812.9–21.7 1m–<1yr231542.740.1–45.317.816.0–19.9 1yr–<2yr80543.038.8–47.418.914.8–22.4 ≥2yr or never107154.050.0–57.928.324.9–31.9

27
Characteristic Sample Size Any VIModerate/Extreme VI %95% CIP% P Have any health care coverage47380.00 Yes415943.641.7–45.619.317.8–20.8 No57953.648.1–59.128.023.5–33.0 Could not see Dr. because of cost47380.00 Yes63961.656.3–66.536.731.8–41.8 No409942.240.2–44.117.716.3–19.2 Last time visited eye care provider47100.00 <1m51938.633.2–44.316.812.9–21.7 1m–<1yr231542.740.1–45.317.816.0–19.9 1yr–<2yr80543.038.8–47.418.914.8–22.4 ≥2yr or never107154.050.0–57.928.324.9–31.9 VI Prevalence by Access to General Health or Eye Care

28
Characteristic Sample Size Any VIModerate/Extreme VI %95% CIP% P Have any health care coverage47380.00 Yes415943.641.7–45.619.317.8–20.8 No57953.648.1–59.128.023.5–33.0 Could not see Dr. because of cost47380.00 Yes63961.656.3–66.536.731.8–41.8 No409942.240.2–44.117.716.3–19.2 Last time visited eye care provider47100.00 <1m51938.633.2–44.316.812.9–21.7 1m–<1yr231542.740.1–45.317.816.0–19.9 1yr–<2yr80543.038.8–47.418.914.8–22.4 ≥2yr or never107154.050.0–57.928.324.9–31.9 VI Prevalence by Access to General Health or Eye Care

29
Characteristic Sample Size Any VIModerate/Extreme VI %95% CIP% P Have any health care coverage47380.00 Yes415943.641.7–45.619.317.8–20.8 No57953.648.1–59.128.023.5–33.0 Could not see Dr. because of cost47380.00 Yes63961.656.3–66.536.731.8–41.8 No409942.240.2–44.117.716.3–19.2 Last time visited eye care provider47100.00 <1m51938.633.2–44.316.812.9–21.7 1m–<1yr231542.740.1–45.317.816.0–19.9 1yr–<2yr80543.038.8–47.418.914.8–22.4 ≥2yr or never107154.050.0–57.928.324.9–31.9 VI Prevalence by Access to General Health or Eye Care

30
VI Prevalence by Lifestyle Characteristics Characteristic Sample Size Any VIModerate/Extreme VI %95% CIP%95% CI)P Physical activity in last 30 days47430.00 Yes349442.340.2–44.417.916.3–19.5 No124953.049.3–56.728.024.9–31.4 Current smoking47290.090.01 Yes79648.743.9–53.425.922.1–30.0 No393344.242.2–46.219.317.8–20.9 Heavy alcohol consumption46760.400.70 Yes15949.239.5–58.822.114.9–31.4 No451744.943.0–46.820.519.0–22.0
P Physical activity in last 30 days Yes – –19.5 No – –31.4 Current smoking Yes – –30.0 No – –20.9 Heavy alcohol consumption Yes – –31.4 No – –22.0")
31
VI Prevalence by Lifestyle Characteristics Characteristic Sample Size Any VIModerate/Extreme VI %95% CIP%95% CI)P Physical activity in last 30 days47430.00 Yes349442.340.2–44.417.916.3–19.5 No124953.049.3–56.728.024.9–31.4 Current smoking47290.090.01 Yes79648.743.9–53.425.922.1–30.0 No393344.242.2–46.219.317.8–20.9 Heavy alcohol consumption46760.400.70 Yes15949.239.5–58.822.114.9–31.4 No451744.943.0–46.820.519.0–22.0
P Physical activity in last 30 days Yes – –19.5 No – –31.4 Current smoking Yes – –30.0 No – –20.9 Heavy alcohol consumption Yes – –31.4 No – –22.0")
32
VI Prevalence by Lifestyle Characteristics Characteristic Sample Size Any VIModerate/Extreme VI %95% CIP%95% CI)P Physical activity in last 30 days47430.00 Yes349442.340.2–44.417.916.3–19.5 No124953.049.3–56.728.024.9–31.4 Current smoking47290.090.01 Yes79648.743.9–53.425.922.1–30.0 No393344.242.2–46.219.317.8–20.9 Heavy alcohol consumption46760.400.70 Yes15949.239.5–58.822.114.9–31.4 No451744.943.0–46.820.519.0–22.0
P Physical activity in last 30 days Yes – –19.5 No – –31.4 Current smoking Yes – –30.0 No – –20.9 Heavy alcohol consumption Yes – –31.4 No – –22.0")
33
VI Prevalence by Lifestyle Characteristics Characteristic Sample Size Any VIModerate/Extreme VI %95% CIP%95% CI)P Physical activity in last 30 days47430.00 Yes349442.340.2–44.417.916.3–19.5 No124953.049.3–56.728.024.9–31.4 Current smoking47290.090.01 Yes79648.743.9–53.425.922.1–30.0 No393344.242.2–46.219.317.8–20.9 Heavy alcohol consumption46760.400.70 Yes15949.239.5–58.822.114.9–31.4 No451744.943.0–46.820.519.0–22.0
P Physical activity in last 30 days Yes – –19.5 No – –31.4 Current smoking Yes – –30.0 No – –20.9 Heavy alcohol consumption Yes – –31.4 No – –22.0")
34
Summary Any VI was significantly more prevalent among: Women Age 40 –64 years Unemployed Less than high school graduate Annual household income <$15,000 “Fair” or “Poor” health Stroke Diabetes No health care coverage Couldn’t see doctor because of cost Last time visited eye care provider: never or ≥2 years No physical activity in last 30 days

35
Multivariate Analytic Methods Broad (Any VI) case definition only Logistic regression model for complex-survey designs Unadjusted and adjusted odds ratios Data analyzed using STATA® 12
 case definition only Logistic regression model for complex-survey designs Unadjusted and adjusted odds ratios Data analyzed using STATA® 12")
36
Odds Ratios for Any VI by Demographics Characteristic Unadjusted OR 95% CIP value Adjusted OR 95% CIP value Race/Ethnicity White, non-Hispanic11 Hispanic1.601.36–1.890.001.170.97–1.420.10 AI/AN1.561.09–2.210.011.210.83–1.780.31 Sex Male1 Female1.181.01–1.370.031.070.91–1.270.37 Age groups(yrs) 40–641.281.10–1.480.001.281.04–1.570.02 ≥6511
 40– – – ≥6511")
37
Odds Ratios for Any VI by Demographics Characteristic Unadjusted OR 95% CIP value Adjusted OR 95% CIP value Race/Ethnicity White, non-Hispanic11 Hispanic1.601.36–1.890.001.170.97–1.420.10 AI/AN1.561.09–2.210.011.210.83–1.780.31 Sex Male1 Female1.181.01–1.370.031.070.91–1.270.37 Age groups(yrs) 40–641.281.10–1.480.001.281.04–1.570.02 ≥6511
 40– – – ≥6511")
38
Odds Ratios for Any VI by Demographics Characteristic Unadjusted OR 95% CIP value Adjusted OR 95% CIP value Race/Ethnicity White, non-Hispanic11 Hispanic1.601.36–1.890.001.170.97–1.420.10 AI/AN1.561.09–2.210.011.210.83–1.780.31 Sex Male1 Female1.181.01–1.370.031.070.91–1.270.37 Age groups(yrs) 40–641.281.10–1.480.001.281.04–1.570.02 ≥6511
 40– – – ≥6511")
39
Odds Ratios for Any VI by Demographics Characteristic Unadjusted OR 95% CIP value Adjusted OR 95% CIP value Race/Ethnicity White, non-Hispanic11 Hispanic1.601.36–1.890.001.170.97–1.420.10 AI/AN1.561.09–2.210.011.210.83–1.780.31 Sex Male1 Female1.181.01–1.370.031.070.91–1.270.37 Age groups(yrs) 40–641.281.10–1.480.001.281.04–1.570.02 ≥6511
 40– – – ≥6511")
40
Odds Ratios for Any VI by Socioeconomic Characteristics Characteristic Unadjusted OR 95% CIP Adjusted OR 95% CIP Employment Status Employed11 Unemployed2.361.49–3.730.002.011.24–3.280.01 Education Level Did not graduate or graduated high school 1.741.49–2.030.001.371.13–1.660.00 Attended or graduated college/technical school 11 Annual Household Income <$50,0001.821.55–2.140.001.341.10–1.630.00 ≥$50,00011

41
Odds Ratios for Any VI by Socioeconomic Characteristics Characteristic Unadjusted OR 95% CIP Adjusted OR 95% CIP Employment Status Employed11 Unemployed2.361.49–3.730.002.011.24–3.280.01 Education Level Did not graduate or graduated high school 1.741.49–2.030.001.371.13–1.660.00 Attended or graduated college/technical school 11 Annual Household Income <$50,0001.821.55–2.140.001.341.10–1.630.00 ≥$50,00011

42
Odds Ratios for Any VI by Socioeconomic Characteristics Characteristic Unadjusted OR 95% CIP Adjusted OR 95% CIP Employment Status Employed11 Unemployed2.361.49–3.730.002.011.24–3.280.01 Education Level Did not graduate or graduated high school 1.741.49–2.030.001.371.13–1.660.00 Attended or graduated college/technical school 11 Annual Household Income <$50,0001.821.55–2.140.001.341.10–1.630.00 ≥$50,00011

43
Odds Ratios for Any VI by Socioeconomic Characteristics Characteristic Unadjusted OR 95% CIP Adjusted OR 95% CIP Employment Status Employed11 Unemployed2.361.49–3.730.002.011.24–3.280.01 Education Level Did not graduate or graduated high school 1.741.49–2.030.001.371.13–1.660.00 Attended or graduated college/technical school 11 Annual Household Income <$50,0001.821.55–2.140.001.341.10–1.630.00 ≥$50,00011

44
Odds Ratios for Any VI by General Health and Comorbidity Characteristic Unadjusted OR 95% CIP Adjusted OR 95% CIP Adults with “good” or better health “Good” or better health11 “Fair” or “poor” health2.011.68–2.400.001.581.28–1.950.00 Ever diagnosed with a stroke Yes1.891.32–2.710.001.551.05–2.290.03 No11

45
Odds Ratios for Any VI by General Health and Comorbidity Characteristic Unadjusted OR 95% CIP Adjusted OR 95% CIP Adults with “good” or better health “Good” or better health11 “Fair” or “poor” health2.011.68–2.400.001.581.28–1.950.00 Ever diagnosed with a stroke Yes1.891.32–2.710.001.551.05–2.290.03 No11

46
Odds Ratios for Any VI by General Health and Comorbidity Characteristic Unadjusted OR 95% CIP Adjusted OR 95% CIP Adults with “good” or better health “Good” or better health11 “Fair” or “poor” health2.011.68–2.400.001.581.28–1.950.00 Ever diagnosed with a stroke Yes1.891.32–2.710.001.551.05–2.290.03 No11

47
Odds Ratios for Any VI by Access to General Health and Eye Care Characteristics Characteristic Unadjusted OR 95% CIP Adjusted OR 95% CIP Could not see Dr. because of cost Yes2.191.74–2.760.0001.611.23–2.110.00 No11 Last time visited eye care provider <2yr11 ≥2yr or never1.601.34–1.920.0001.421.16–1.740.00

48
Odds Ratios for Any VI by Access to General Health and Eye Care Characteristics Characteristic Unadjusted OR 95% CIP Adjusted OR 95% CIP Could not see Dr. because of cost Yes2.191.74–2.760.0001.611.23–2.110.00 No11 Last time visited eye care provider <2yr11 ≥2yr or never1.601.34–1.920.0001.421.16–1.740.00

49
Odds Ratios for Any VI by Access to General Health and Eye Care Characteristics Characteristic Unadjusted OR 95% CIP Adjusted OR 95% CIP Could not see Dr. because of cost Yes2.191.74–2.760.0001.611.23–2.110.00 No11 Last time visited eye care provider <2yr11 ≥2yr or never1.601.34–1.920.0001.421.16–1.740.00

50
Discussion NM-specific estimates of self-reported prevalence of VI VI prevalence substantially higher by using broad (any VI) than narrow (M/E VI Only) case definitions Comparison to other states?
 than narrow (M/E VI Only) case definitions Comparison to other states")
53
Significant Associations with Any VI Middle age: Access to care/Medicare? Stroke history, “fair” or “poor” health: Less likely to comply with annual eye appointments? Lower socioeconomic status (unemployed, lower education, lower income): May be associated with less access to eye care or limited vision health literacy? Limited care access: medical cost, regular visits to eye care provider?
: May be associated with less access to eye care or limited vision health literacy. Limited care access: medical cost, regular visits to eye care provider .")
54
Nonsignificant Associations with Any VI Demographics: race/ethnicity, sex and lifestyle factors: smoking, drinking, exercise Initial unadjusted associations confounded by other covariates Inconsistent with past literature: were past studies properly controlling for confounding factors? Comorbidity: Diabetes Diabetic retinopathy is a leading cause of visual impairment Outcome of interest in this study was VI from any cause

55
Study Limitations Self-reported visual impairment BRFSS data collection by landline telephone Survey of civilian noninstitutionalized population Cross-sectional survey Not generalizable beyond NM population

56
Conclusions VI prevalence varied substantially by different case definitions VI prevalence highest among Hispanics and AI/ANs Any VI in NM significantly associated with Middle age Stroke history Limited care access Lower socioeconomic status Any VI in NM not significantly associated with race/ethnicity

57
Recommendations Address New Mexico’s VI disparities through vision health initiative Access to eye care services Eye health literacy among groups at high risk Continue surveillance of VI is important to better understand and plan for New Mexico’s vision care needs Investigate eye care barriers to develop specific vision-loss prevention and eye-health promotion programs Standardize case definition of vision loss in surveys and validate self-reporting methods

58
For more information please contact Centers for Disease Control and Prevention 1600 Clifton Road NE, Atlanta, GA 30333 Telephone, 1-800-CDC-INFO (232-4636)/TTY: 1-888-232-6348 E-mail: cdcinfo@cdc.gov Web: www.cdc.gov The findings and conclusions in this report are those of the authors and do not necessarily represent the official position of the Centers for Disease Control and Prevention. Acknowledgments Office of Surveillance, Epidemiology, and Laboratory Services Scientific Education and Professional Development Program Office NM DOH: Michael Landen Wayne Honey Tierney Murphy Dan Green Mack Sewell CDC: Julie Magri John Crews Sheryl Lyss Jinan Saaddine Byron Robinson Betsy Cadwell

59
Conceptual Model for the Development of VI Baseline Absence of VI Sociodemograp hic Factors: Increased Age Male Gender Minorities (e.g. Hispanic Ethnicity) Decreased Acculturation Decreased Income Psychological Attributes: Decreased Social Support Depression Personal Health Practice Factors: Decreased Physical Activity No Knowledge of Eye Disease Decreased Intake of Antioxidant Supplements Biologic Risk Factors: Diabetes Complications: (Increased duration of diabetes, increased number of comorbidities, Increased blood pressure, increased BMI, HLA/genetic factors) Diabetes Severity/Control: (Increased HbA1c, increased blood glucose, increased insulin use) Increased Incidence/ Prevalence of VI Health Car Access and Utilization Factors: Decreased Health Care Coverage No Attitudes towards Health Care Decreased Utilization of Health/Eye Care Preventive Care Increased Barriers to Care
 Decreased Acculturation Decreased Income Psychological Attributes: Decreased Social Support Depression Personal Health Practice Factors: Decreased Physical Activity No Knowledge of Eye Disease Decreased Intake of Antioxidant Supplements Biologic Risk Factors: Diabetes Complications: (Increased duration of diabetes, increased number of comorbidities, Increased blood pressure, increased BMI, HLA/genetic factors) Diabetes Severity/Control: (Increased HbA1c, increased blood glucose, increased insulin use) Increased Incidence/ Prevalence of VI Health Car Access and Utilization Factors: Decreased Health Care Coverage No Attitudes towards Health Care Decreased Utilization of Health/Eye Care Preventive Care Increased Barriers to Care.")
60
Common Eye Disorders Infancy and Childhood (Birth to Age 18) Amblyopia, Strabismus, and Refractive Errors Adults Younger Than Age 40 Refractive Errors, Eye Injury, and Diabetic Retinopathy Adults Older Than Age 40 Cataract, Diabetic Retinopathy, Glaucoma, Macular Degeneration Source: CDC’s Vision Health Initiative
 Amblyopia, Strabismus, and Refractive Errors Adults Younger Than Age 40 Refractive Errors, Eye Injury, and Diabetic Retinopathy Adults Older Than Age 40 Cataract, Diabetic Retinopathy, Glaucoma, Macular Degeneration Source: CDC’s Vision Health Initiative")
61
Healthy People 2010 : Chapter 28 Vision Objectives 28-1: Increase the proportion of persons who have a dilated eye examination at appropriate intervals 28-2: Increase the proportion of preschool children aged 5 years and younger who receive vision screening 28-3: Reduce uncorrected visual impairment due to refractive errors 28-4: Reduce blindness and visual impairment in children and adolescents aged 17 years and younger 28-5: Reduce visual impairment due to diabetic retinopathy 28-6: Reduce visual impairment due to glaucoma 28-7: Reduce visual impairment due to cataract 28-8: Reduce occupational eye injury 28-9: Increase the use of appropriate personal protective eyewear in recreational activities and hazardous situations around the home 28-10: Increase vision rehabilitation

62
Economic Impact of Vision Loss in the United States — Total $51 Billion Source: CDC’s Vision Health Initiative

63
Vision Disability

64
BRFSS Vision/Eye Module How much difficulty, if any, do you have in recognizing a friend across the street? How much difficulty, if any, do you have reading print in newspaper, magazine, recipe, menu, or numbers on the telephone? When was the last time you had your eyes examined by any doctor or eye care provider? What is the main reason you have not visited an eye care professional in the past twelve months? When was the last time you had an eye exam in which the pupils were dilated? This would have made you temporarily sensitive to bright light. Do you have any kind of health insurance coverage for eye care? Have you been told by an eye doctor or other health care professional that you NOW have cataracts? Have you EVER been told by an eye doctor or other health care professional that you had glaucoma? Have you EVER been told by an eye doctor or other health care professional that you had macular degeneration?

Similar presentations


 A joint program of NIH and CDC Diabetes: The Numbers Revised.>")
