Download presentation
Presentation is loading. Please wait.

1
Highway Data Workshop Highway Data Workshop February, 2010 Highway Data Services Bureau New York State Department of Transportation 50 Wolf Road, 3-2 Albany, New York 12232 (518) 457-1965 Welcome back to the…
 Welcome back to the…")
2
THIS MORNING Functional Class Map Viewer Functional Class Map Viewer Newest Data on the Web Newest Data on the Web Traffic Data Analysis/Forecasting Traffic Data Analysis/Forecasting –Project Level Forecasts –Traffic Assignment Modeling –Vehicle Miles of Travel

3
Functional Class Maps - A proposed approach for the next update Old approach Old approach –Static pdf images Difficult to produce Difficult to produce Do not reflect subsequent approved changes Do not reflect subsequent approved changes Proposed approach Proposed approach –Functional Class Viewer Based on an approved FC system Based on an approved FC system Approved changes applied immediately Approved changes applied immediately Updated GIS files readily available Updated GIS files readily available

4
Functional Class Viewer Internet-based viewer Internet-based viewer Based on approved system as encoded in a GIS-based file Based on approved system as encoded in a GIS-based file Link to original approval document Link to original approval document Revisions noted by link to approval memos Revisions noted by link to approval memos Revised GIS data regularly distributed Revised GIS data regularly distributed http://wvmoap22/fc/

7
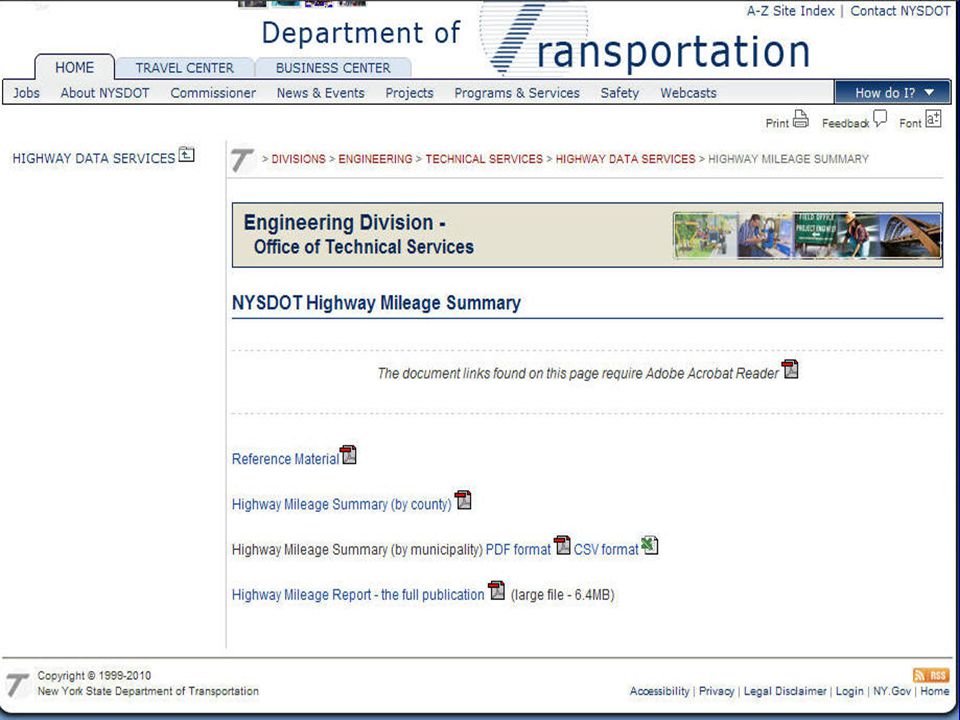
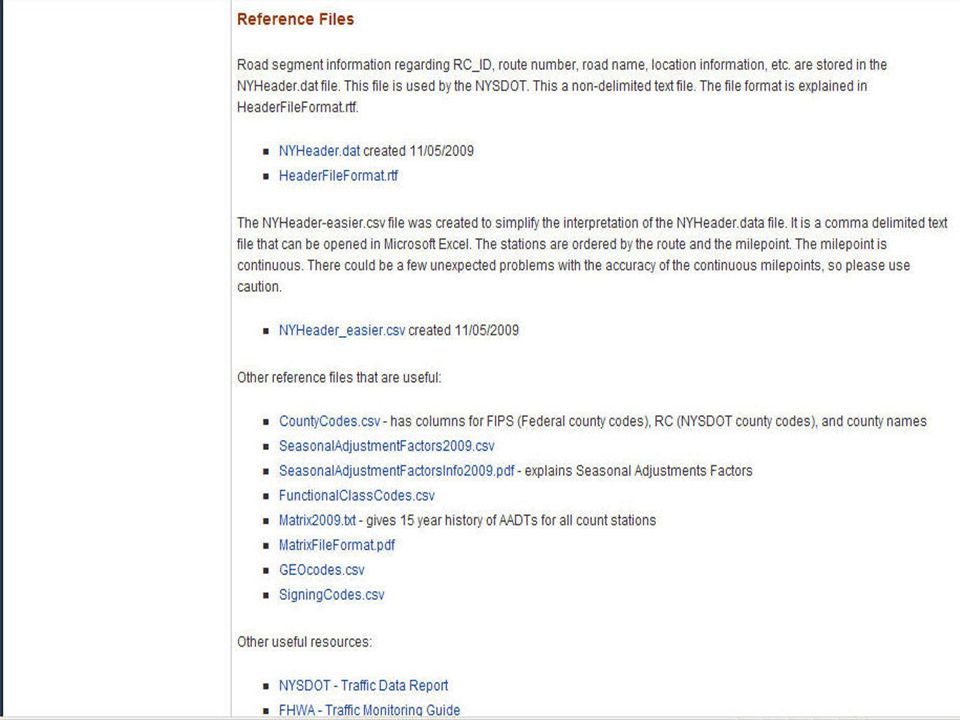
Data on the Web Highway Data Highway Data Detailed Inventory Listings Detailed Inventory Listings Functional Class Maps Functional Class Maps Highway Mileage Report Highway Mileage Report Traffic Data Traffic Data Traffic Data Report Traffic Data Report Hourly Traffic Volume Files Hourly Traffic Volume Files Reference and Factor Files Reference and Factor Files

8
Highway Data Services Bureau www.nysdot.gov www.nysdot.gov www.nysdot.gov –A to Z Site Index Select “H” Select “H” –Select “Highway Data Services Bureau”

19
Other NYSDOT Links https://www.nysdot.gov/divisions/ https://www.nysdot.gov/divisions/policy-and-strategy/darb/dai-unit/ttss –FHWA/FTA approved Urban Areas –Census-based Urban Areas –Metropolitan Planning Areas –Statewide Annual VMT since 1920

20
Other NYSDOT Links https://www.nysdot.gov/divisions/ https://www.nysdot.gov/divisions/policy-and-strategy/darb/dai-unit/ttss Traffic Change in New York State Traffic Change in New York State –Change in Traffic on NYS Bridges, Thruway and Roads, January 2010 –Contains transit and other data as well as traffic data

21
Other NYSDOT Links https://www.nysdot.gov/divisions/ https://www.nysdot.gov/divisions/ operating/oom/transportation- systems/manuals –Qualifying and Access Highways (trucks) –Touring Route Book https://www.nysdot.gov/divisions/ https://www.nysdot.gov/divisions/engineering/design/dqab/rmm –Reference Marker Manual
 –Touring Route Book –Reference Marker Manual")
22
Other NYSDOT Links https://www.nysdot.gov/main/bridgedata https://www.nysdot.gov/main/bridgedata –Bridge information (BIN, condition, location) http://gisweb2/strviewer/ http://gisweb2/strviewer/ –Viewer showing location of all bridges and culverts with condition ratings and postings –Only available internally (Intradot)
 –Viewer showing location of all bridges and culverts with condition ratings and postings –Only available internally (Intradot)")
23
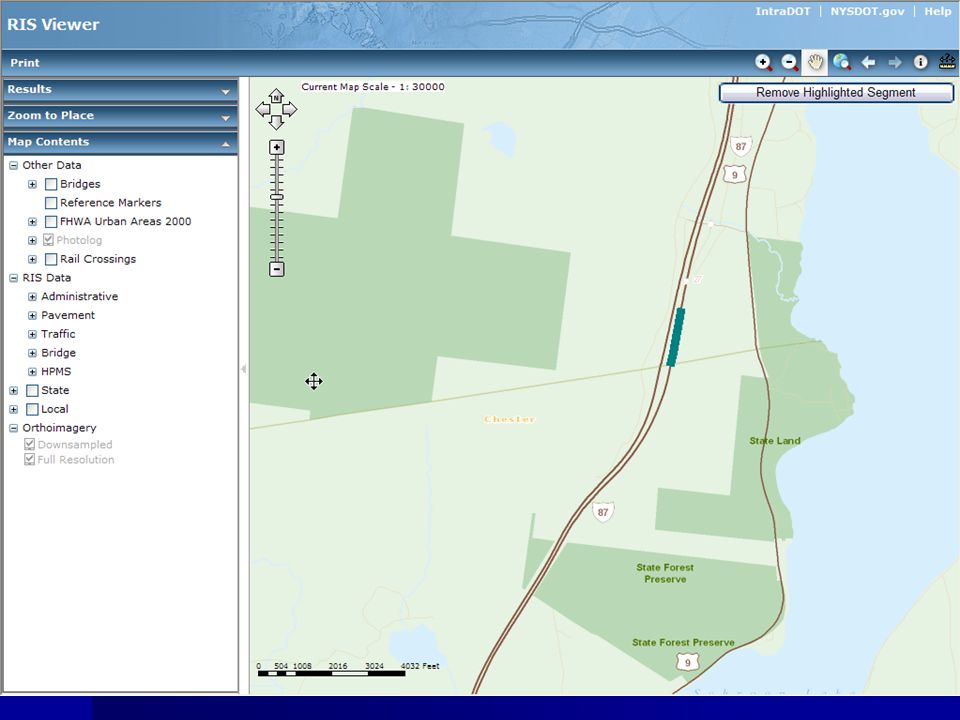
Potential RIS Viewer Currently in development Currently in development Hope to eventually offer via the Internet Hope to eventually offer via the Internet Links RIS data to GIS, orthoimagery, Photolog Links RIS data to GIS, orthoimagery, Photolog Links from within RIS or directly through viewer interface Links from within RIS or directly through viewer interface

29
THIS MORNING Functional Class Map Viewer Functional Class Map Viewer Newest Data on the Web Newest Data on the Web Traffic Data Analysis/Forecasting Traffic Data Analysis/Forecasting –Project Level Forecasts –Traffic Assignment Modeling –Vehicle Miles of Travel

30
An Overview of Traffic Data Analysis & Forecasting

31
HDSB Forecasting Current year estimates Current year estimates –Matrix process –Traffic Data Forecaster HPMS HPMS –Current year estimates –VMT estimates All based on linear regression All based on linear regression

32
US VMT Growth Since 1984

33
NYS VMT Growth Since 1920

34
Traffic Count Data Traffic Count Data What is collected Volume Volume Vehicle Classification Vehicle Classification Speed Speed Weigh-in-Motion Weigh-in-Motion

35
Traffic Count Stations Traffic Count Stations Where it is collected COMPREHENSIVE COVERAGE COMPREHENSIVE COVERAGE State Highways/State System National Highway System All Other Federal Aid Eligible Roads SEGMENT SPECIFIC SEGMENT SPECIFIC Highway Performance Monitoring System NHS Intermodal Connectors Bridges, Railroad Crossings Sampling of non-Federal Aid highways County counting partnership, MPOs County counting partnership, MPOs

36
Traffic Count Coverage Traffic Count Coverage When it is collected State Highways/State System – 3 yrs State Highways/State System – 3 yrs HPMS Samples – 3 yrs HPMS Samples – 3 yrs National Highway System – 3 yrs National Highway System – 3 yrs Including Intermodal Connectors Federal Aid eligible roads – 6 yrs Federal Aid eligible roads – 6 yrs Bridges, Railroad Crossings – 5 yrs Bridges, Railroad Crossings – 5 yrs Sampling of non-Federal Aid roads – 6 yrs Sampling of non-Federal Aid roads – 6 yrs Special needs – on demand Special needs – on demand

37
Traffic Count Data Traffic Count Data How it is collected Continuous versus short counts Continuous versus short counts Continuous About 175 sites Daily and other temporal patterns Design hour volume factors Short (coverage) counts Large quantity at low cost Stations covering about 30,000 miles
 counts Large quantity at low cost Stations covering about 30,000 miles")
38
Some of the Data Users Some of the Data Users Why it is collected Internal Users of Traffic Data Planners – MPOs, Policy & Planning Div. Planners – MPOs, Policy & Planning Div. AADT, hourly, quarter hour CNAM, BNAM, PNAM, traffic assignment models Designers – scope and scale Designers – scope and scale AADT, DHV/DDHV, % trucks, turn moves Traffic Engineers – safety analyses Traffic Engineers – safety analyses Maintenance/Construction - MPOT Maintenance/Construction - MPOT

39
Some of the Data Users Some of the Data Users Why it is collected External Users Air quality planners/researchers Air quality planners/researchers Transportation researchers - professors & students, public & non-profit agencies Transportation researchers - professors & students, public & non-profit agencies Realtors/developers Realtors/developers Lawyers Lawyers Health researchers Health researchers New York State Police New York State Police

40
Available Data AADT – Inventories, TDR, TDV, Matrix AADT – Inventories, TDR, TDV, Matrix Hourly – Interval data on Internet Hourly – Interval data on Internet Class, Speed – reports on TDV, data files on request Class, Speed – reports on TDV, data files on request Adjustment factors – axle, “seasonal” Adjustment factors – axle, “seasonal” DHV, DDHV, K factor/d factor DHV, DDHV, K factor/d factor Vehicle Miles of Travel Vehicle Miles of Travel –HPMS estimates by FC by Urban Area

41
Vehicle Classifications Based on axle spacing via speed with which tubes are crossed 1 Motorcycles 1 Motorcycles 2 Passenger Cars 2 Passenger Cars 3 Two axle, four tire trucks 3 Two axle, four tire trucks 4 Buses 4 Buses 5 Two axle, six tire 5 Two axle, six tire 6-10 Single trailer, varying no. of axles 6-10 Single trailer, varying no. of axles 11-13 Double trailer, varying axles 11-13 Double trailer, varying axles

42
Vehicle Classifications

43
“Seasonal” adjustments - Monthly Variations Use continuous counter data Use continuous counter data Calculate 12 monthly averages of the daily traffic (MADT) Calculate 12 monthly averages of the daily traffic (MADT) Average 12 MADTs to get an Annual Average of the Daily Traffic (AADT) Average 12 MADTs to get an Annual Average of the Daily Traffic (AADT) Ratio of each MADT to AADT gives monthly factor Ratio of each MADT to AADT gives monthly factor
 Calculate 12 monthly averages of the daily traffic (MADT) Average 12 MADTs to get an Annual Average of the Daily Traffic (AADT) Average 12 MADTs to get an Annual Average of the Daily Traffic (AADT) Ratio of each MADT to AADT gives monthly factor Ratio of each MADT to AADT gives monthly factor")
44
“Seasonal” adjustments - Daily Variations Calculate using only weekdays (Mon to Fri noon) Calculate using only weekdays (Mon to Fri noon) Calculate using only weekend traffic Calculate using only weekend traffic Yields three sets of adjustment factors Yields three sets of adjustment factors –Full week or seven day, weekday, weekend Daily variations are “lost” in monthly calculations Daily variations are “lost” in monthly calculations Weekday factors most commonly used Weekday factors most commonly used Seven day factors show true “seasonality” Seven day factors show true “seasonality”
 Calculate using only weekdays (Mon to Fri noon) Calculate using only weekend traffic Calculate using only weekend traffic Yields three sets of adjustment factors Yields three sets of adjustment factors –Full week or seven day, weekday, weekend Daily variations are lost in monthly calculations Daily variations are lost in monthly calculations Weekday factors most commonly used Weekday factors most commonly used Seven day factors show true seasonality Seven day factors show true seasonality")
45
Factor Groups Stations stratified into FG based on 1980’s analyses Stations stratified into FG based on 1980’s analyses Minimal seasonality (commuter dominated) Some seasonality Highly seasonal Even winter resorts show summer peaks Even winter resorts show summer peaks Region 7 reassessment in late 1990’s Region 7 reassessment in late 1990’s “Flattening” of curves “Flattening” of curves NY metro area is “average” (FG = 30) NY metro area is “average” (FG = 30)
 Some seasonality Highly seasonal Even winter resorts show summer peaks Even winter resorts show summer peaks Region 7 reassessment in late 1990’s Region 7 reassessment in late 1990’s Flattening of curves Flattening of curves NY metro area is average (FG = 30) NY metro area is average (FG = 30)")
47
Design Hour Volumes and Directional Design Hour Volumes 30 th highest hour 30 th highest hour Used for scaling capital projects Used for scaling capital projects Continuous counters used to calculate DHV and DDHV factors (K and d) Continuous counters used to calculate DHV and DDHV factors (K and d) Good for system analyses but questionable for project level Good for system analyses but questionable for project level Site specific three-day high-hour versus ADT may give better project results Site specific three-day high-hour versus ADT may give better project results
 Continuous counters used to calculate DHV and DDHV factors (K and d) Good for system analyses but questionable for project level Good for system analyses but questionable for project level Site specific three-day high-hour versus ADT may give better project results Site specific three-day high-hour versus ADT may give better project results")
48
Design Hour Volumes and Directional Design Hour Volumes 30 th highest hour is used as a result of NCHRP study 30 th highest hour is used as a result of NCHRP study Example: count station 26 0120 in Utica Example: count station 26 0120 in Utica Highest Hour=3991 30 th Hour=3780 100 th Hour=3640 200 th Hour=3523

49
Design Hour Volumes K*d and K Factors Factor Group DDHVDHV 306.1%10.2% 406.7%11.6% 608.7%14.2%

50
Vehicle Miles of Travel HPMS Statewide Estimates

51
Vehicle Miles of Travel HPMS Urban Area Estimates

52
AIR QUALITY INPUTS Travel Speeds Originally based on 1990 estimations of speed Vehicle Miles of Travel Should be “based on HPMS” traffic data Vehicle Classifications Axle-based classifications collected Fuel and weight based data not field collected

53
Project Level Forecasts Basic techniques Traffic Assignment Models Selected concepts & impact on forecasts Vehicle Miles of Travel Estimates HPMS estimates and ad hoc approaches

54
Design forecast needs Growth rates Using site specific traffic data Turning movements MPT “forecasts”

55
Forecast parameters Historical traffic data Trend analysis Consistency with other forecasts Constrained vs. Unconstrained Model coordination

56
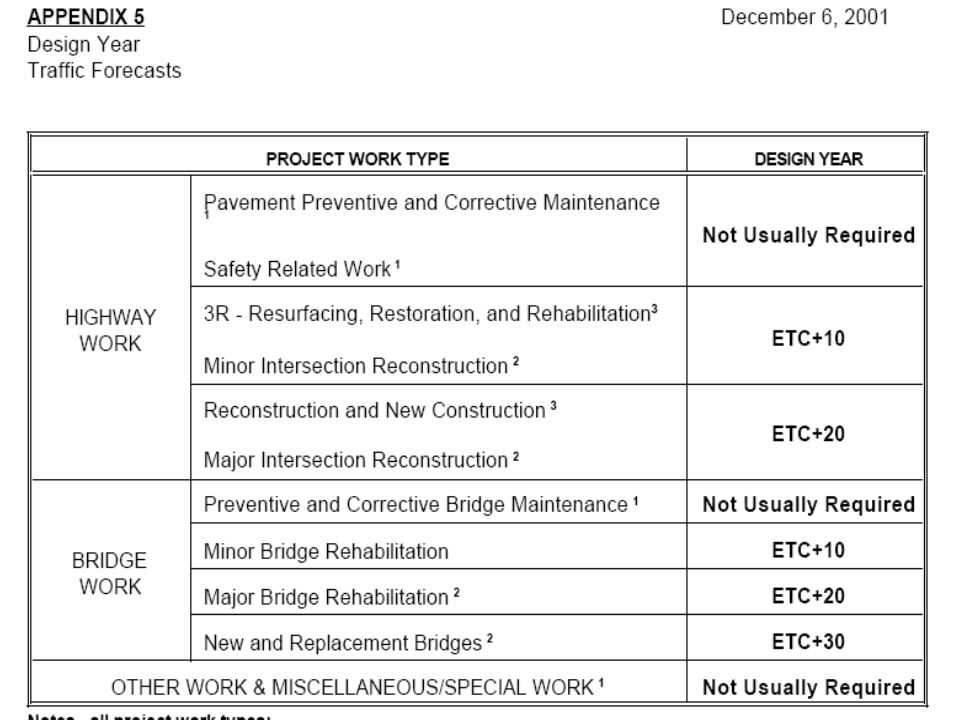
Time frame Date of completion/opening of project Date of forecast life (design life) of project Complex projects may include multiple
 of project Complex projects may include multiple")
58
Time frame Date of completion/opening of project Date of forecast life (design life) of project Complex projects may include multiple Multiple forecasts No build Each build alternative Different alternatives may result in differing forecast parameters
 of project Complex projects may include multiple Multiple forecasts No build Each build alternative Different alternatives may result in differing forecast parameters")
59
Time Frame Build/no-build forecasts % Trucks Awareness of design thresholds Mainline Turn lane Awareness of generators/constraints

60
Most typical forecasting approach Simple or compound Simple: AADT x [1+(rate x # yrs)] Compound: AADT x (1+rate)exp[# yrs] Past patterns indicate Simple is most realistic Generic or site-specific rates Rural Forecasting Method Nathan Erlbaum, 457-2967
![ Most typical forecasting approach Simple or compound Simple: AADT x [1+(rate x # yrs)] Compound: AADT x (1+rate)exp[# yrs] Past patterns indicate Simple is most realistic Generic or site-specific rates Rural Forecasting Method Nathan Erlbaum,](http://images.slideplayer.com/13/3764629/slides/slide_60.jpg " Most typical forecasting approach Simple or compound Simple: AADT x [1+(rate x # yrs)] Compound: AADT x (1+rate)exp[# yrs] Past patterns indicate Simple is most realistic Generic or site-specific rates Rural Forecasting Method Nathan Erlbaum,")
62
Very common is to assume 1 or 2% Trend line from specific station/stations Growth rates from Matrix/HPMS processes Stratified by Region and Functional Class Generate a rate using Traffic Data Forecaster Need for rigor depends on sensitivity of project to variations in the forecasts

65
Growth rate of 1% per year Matrix growth of 1.37%

66
Forecast ranges from ~31,000 to ~46,000 DDHV at 6% ranges from ~1600 to ~2800 Capacity for a multi-lane urban arterial is about 800 vehicles/lane/hour 2 lanes ~1600 3 lanes ~2400 4 lanes ~3200 This forecast could yield a need for a four, six, or eight lane arterial based on the assumptions

67
Which forecast do you use? ANSWER: Use Your Professional Judgment

68
Use appropriate sites for source data More data is better for trending Continuous count data is best Generic DHV, DDHV factors used as default Prefer site specific estimates of DHV, even with short counts

70
7-88-99-1010-1111-1212-11-22-33-4 4-5 5-66-7ADT 134315271086110412271396141314171730173517121231 21895 6447346266447877567437829011139926620 11766 198722611712174820142152215621992631287426381851 33661 DHV factor2874 / 33661 = 8.5% DDHV factor1735 / 33661 = 5.1% Dir Split1735 / 2874 = 60/40 AADT30,050 DHV 8.5% x 30050 = 2600 DDHV 5.1% x 30050 = 1530

71
Estimate of DDHV using generic 6%: 30,050 x 0.06 = 1800 Estimate of DDHV using short count high hour: 30,050 x 0.05 = 1500 Arterial capacity ~800/lane/hour Two lanes = 1600/hour Capacity is a threshold value of concern

72
Factor Group 30, generic DDHV factor - 6% High Hour/ADT factor from short count-5.1% 30 th highest hr from adjacent cc site-5.2%

73
Needed data for Route 17 and a connecting County Road for the I-86 project Designers questioned the AADTs Found continuous count stations on Route 17 near the project area Used Monthly adjustment patterns from three local cc stations to adjust the ADT from Route 17 and CR counts to a new AADT estimate

75
JanFebMarAprilMayJuneJulyAugSeptOctNovDec FG40 0.8 0.9 1.1 1.2 1.11.00.90.8 Avg 0.80.9 1.11.2 1.5 1.2 0.9 9631 0.80.9 1.11.31.21.51.61.31.21.30.9 9632 0.8 0.91.01.1 1.4 1.1 1.00.9

76
Not easy to project Use same proportions as in existing turn count If 5% of traffic turns left today, assume 5% left turns in future …. if it makes sense! Known growth patterns Known restrictions May need alternative methods Trip generation, “professional judgment”

81
Maintenance and Protection of Traffic Require much more site & date specificity Require construction year estimates May need per lane volumes Required to determine volumes for Detours Number of lanes Time of day for restrictions

82
Traffic Assignment Modeling Four Step Process Trip Generation Trip Generation Trip Distribution Trip Distribution Mode Choice Mode Choice Route Assignment Route Assignment

83
Traffic Assignment Modeling Daily vs peak period modeling Daily vs peak period modeling Productions/attractions Productions/attractions ProductionsAttractions –AMHomeWork place –NoonHome/workRestaurants/shops –PMWork/shopsHome

84
Trip Generation Productions/attractions Productions/attractions –Census data –Land use data “Trip Generation, 8th Edition: An ITE Informational Report “ “Trip Generation, 8th Edition: An ITE Informational Report “

85
Traffic Analysis Zones Productions/attractions “loaded” at centroid of TAZs Productions/attractions “loaded” at centroid of TAZs Centroids connected to network Centroids connected to network Familiarity with TAZ structure and linkages could be critical to evaluation of model output Familiarity with TAZ structure and linkages could be critical to evaluation of model output

89
Traffic Analysis Zones and Census Tracts Traffic Analysis Zone Traffic Analysis Zone –Should focus around highways Census Blocks & Tracts Census Blocks & Tracts –Focus on boundaries of convenience Center of streets Center of streets RR lines RR lines Visible demarcations Visible demarcations

90
Loading the Network All or nothing All or nothing Pre-load Pre-load Iterative Iterative Constrained vs. unconstrained Constrained vs. unconstrained

91
Calibration & Impedances Calibrating to existing data Calibrating to existing data “Friction” based on attributes “Friction” based on attributes –Real or artificial impedances Factors Used to Decrease Gaps in Estimation Factors Used to Decrease Gaps in Estimation –Differences and Ratios NOCoTS NOCoTS New bridge New bridge

92
Use of Model Output FHWA course – 5 full days FHWA course – 5 full days Most useful for relative comparisons Most useful for relative comparisons –Between forecast years –Between alternatives –Between various paths Provides another tool in forecasting Provides another tool in forecasting Best use as systems analysis tool Best use as systems analysis tool

93
Vehicle Miles of Travel - -HPMS VMT estimates - -Air quality VMT estimates - -Developing ad hoc estimates

94
What is it? VMT = annual Vehicle Miles of Travel DVMT = Daily Vehicle Miles of Travel Sometimes seen as VDT (Vehicle Distance of Travel) to make it unit neutral It is an additive measure of cumulative travel AADT and other measures are actually rates which are time and location dependent Use of VMT eliminates that dependency
 to make it unit neutral It is an additive measure of cumulative travel AADT and other measures are actually rates which are time and location dependent Use of VMT eliminates that dependency.")
95
VMT Estimation VMT = AADT x segment length Can be calculated for State System where traffic counts are relatively comprehensive Estimated for non-State Federal aid eligible highways within HPMS using Sample expansion Stratified by Urban, Rural, Small Urban areas

96
VMT Accuracy Within HPMS, accuracy is affected by Sample “adequacy” and quality of “current year estimates” of AADT Local VMT is more challenging given the difficulty of measuring both baseline traffic and growth

97
HPMS Sample Domains Rural – 406 Samples statewide Small Urban – 395 Samples statewide Urbanized – # Samples for each area: 345New York76Elmira 218Buffalo201Poughkeepsie/Newburgh 195Rochester60Glens Falls 208Albany43Ithaca 172Syracuse45Kingston 152Utica37Saratoga Springs 136Binghamton

98
Stratification By Volume Group By Functional Class Albany Urban Area – 208 Samples FCSamples 1144 1223 1447 1641 1753

99
VMT Estimation AADT x length to calculate VMT for Samples For each Sample Domain / FC / Volume Group, Expansion Factor = Total length / Sample length VMT Estimate = Sample VMT x Exp Factor Sum VMT Estimates

100
HPMS VMT Estimation Entire VMT estimation for Federal Aid roads is based on Sample data (all other traffic counts ignored) Non-Federal Aid VMT (FC 08, 09, 19) based on adjustment of prior year VMT estimate
 Non-Federal Aid VMT (FC 08, 09, 19) based on adjustment of prior year VMT estimate")
101
HPMS VMT Estimation Used to be based on adjustments to meet a statewide total VMT estimate Changed to Sample expansion with assignment of residual then adjustment of residual Will be changed to full calculation of Federal Aid VMT … if we have the counts

102
Vehicle Miles of Travel

104
HPMS VMT Estimation Based on Current Year Estimates Current Year Estimates derived from Matrix process Matrix process is a 15 year straight line regression analysis Does not reflect short term changes, but should it? Depends on purpose

105
AIR QUALITY INPUTS Travel Speeds Originally based on 1990 estimations of speed Vehicle Miles of Travel Vehicle Miles of Travel Should be “based on HPMS” traffic data Should be “based on HPMS” traffic data Vehicle Classifications Axle-based classifications collected Fuel and weight based data not field collected

106
AIR QUALITY INPUTS Traffic data HPMS VMT estimates Global Insight model output Time series models using HPMS VMT and socio- demographics to produce urban area forecasts National Household Travel Survey (NHTS) Estimates of VMT and urban area trip rates Surveys conducted in 1995, 2001, 2009
 Estimates of VMT and urban area trip rates Surveys conducted in 1995, 2001, 2009")
107
AIR QUALITY INPUTS Contacts Nathan Erlbaum, System Performance & Asset Management Bureau 518-457-2967, NErlbaum@dot.state.ny.us Patrick Lentlie, Office of the Environment 518-457-0212, Plentlie@dot.state.ny.us

108
Uses of VMT Estimates Planners for estimation of future growth in traffic and in economy FHWA for funding allocations National Highway Traffic Safety Admin for safety funding allocations NYSDOT internally for funding distributions Outside groups to estimate air quality, health, economic, and travel impacts

109
Uses of VMT Estimates Some of these uses require different stratifications than those produced via HPMS No other “official” VMT estimates are produced by NYSDOT (except those required for Air Quality)
")
110
Ad Hoc Estimates of VMT Requires: All available AADT data Length of system counted Total length of system Source: Inventory spreadsheets on Internet Other HDSB resources Highly dependent on stratification for expansion

111
Example – FC 16, Albany County Expand with no stratification: Total Mileage – 114 Mileage with AADT – 58 VMT on counted roads – 580,139 580,139 x 114/58 = 1,142,874 VMT 7.6 miles contain HPMS Samples

112
Example – FC 16, Albany County Expand stratified by Muni Type: UnstratifiedCitiesTownsVillagesTotal Total Miles113.946.660.07.4113.9 Miles counted57.814.937.45.557.8 VMT counted580,139135,186380,24464,709580,139 Exp Factor1.973.131.601.35-- Expanded VMT 1,142,874 423,132228,14687,357 738,635

113
Stratification Note: HPMS stratifies by Volume Group which I did not do here Stratifying by Muni Type illustrates the variability in estimation approach Similarly, stratification by Functional Class has been shown to yield large variations Including Volume Group stratification seems to be the best approach

114
Recommendations Stratify by several different parameters to see if converge Include Volume Group as one of the stratification parameters Check stratification by various parameters against HPMS values for the same Sample domains Use professional judgment

Similar presentations


>")
 Be able to.>")


 Urban Transportation Planning System –Also known as the Four - Step Process –A methodology.>")