Download presentation
Presentation is loading. Please wait.

1
Example 2 The following table gives the mileage y, in miles per gallon, of a certain car at various speeds x (in miles per hour). a) Use a graphing utility to create a scatter plot of the data. b) Use the regression feature of a graphing utility to find a quadratic model that best fits the data. c) Use the model to predict the speed that gives the greatest mileage. Speed, x Mileage, y 10, 21.345, 31.9 15, 23.750, 29.5 20, 25.955, 27.6 25, 27.660, 25.3 30, 29.465, 23.0 35, 31.070, 20.0 40, 31.7
 Use a graphing utility to create a scatter plot of the data. b) Use the regression feature of a graphing utility to find a quadratic model that best fits the data. c) Use the model to predict the speed that gives the greatest mileage. Speed, x Mileage, y 10, , , , , , , , , , , , ,")
2
Example 2 The following table gives the mileage y, in miles per gallon, of a certain car at various speeds x (in miles per hour). a) Use a graphing utility to create a scatter plot of the data. b) Use the regression feature of a graphing utility to find a quadratic model that best fits the data. c) Use the model to predict the speed that gives the greatest mileage. Speed, x Mileage, y 10, 21.345, 31.9 15, 23.750, 29.5 20, 25.955, 27.6 25, 27.660, 25.3 30, 29.465, 23.0 35, 31.070, 20.0 40, 31.7
 Use a graphing utility to create a scatter plot of the data. b) Use the regression feature of a graphing utility to find a quadratic model that best fits the data. c) Use the model to predict the speed that gives the greatest mileage. Speed, x Mileage, y 10, , , , , , , , , , , , ,")
3
Example 3 For the data points below, determine whether a linear model or a quadratic model best fits the data. (1, 5) (2, 6) (3, 8) (4, 9) (5, 11) (6, 10) (7, 11) (8, 12) (9, 14) (10, 16)
 (2, 6) (3, 8) (4, 9) (5, 11) (6, 10) (7, 11) (8, 12) (9, 14) (10, 16).")
4
Example 3 For the data points below, determine whether a linear model or a quadratic model best fits the data. (1, 5) (2, 6) (3, 8) (4, 9) (5, 11) (6, 10) (7, 11) (8, 12) (9, 14) (10, 16)
 (2, 6) (3, 8) (4, 9) (5, 11) (6, 10) (7, 11) (8, 12) (9, 14) (10, 16).")
5
#1 Sketch the graph of by hand and identify the vertex and the intercepts.

7
#2 Find the number of units that produce a minimum cost C if

9
#3 Find the quadratic function that has a maximum at (1, 7) and passes through the point (2, 5).
 and passes through the point (2, 5).")
10
maximum at (1, 7) and passes through the point (2, 5).
 and passes through the point (2, 5).")
11
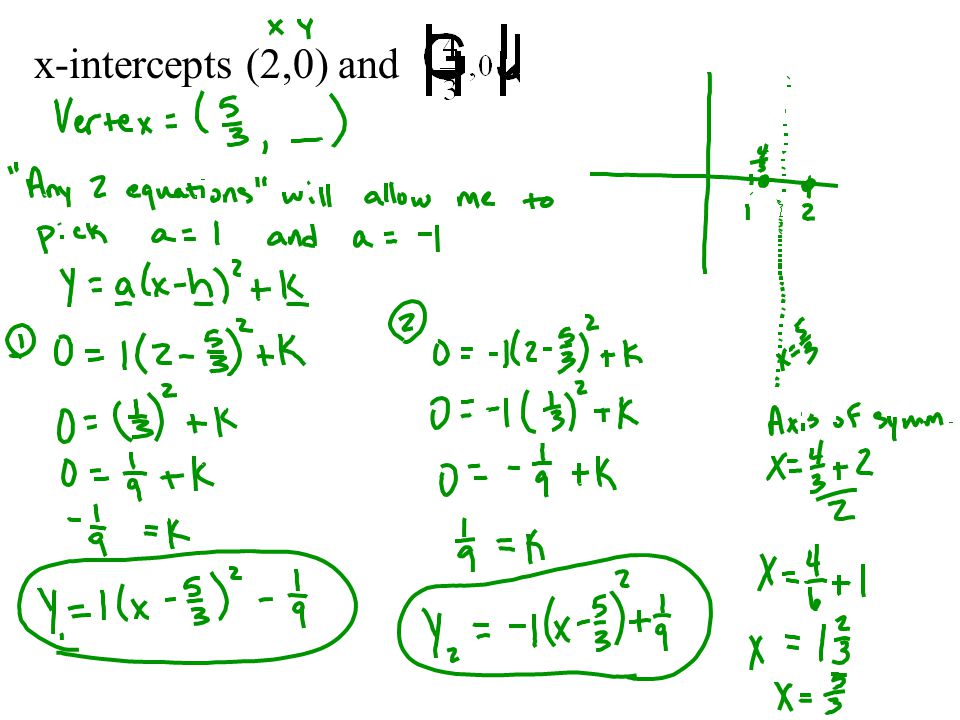
#4 Find two quadratic functions that have x-intercepts (2,0) and
 and")
13
#5 Use the leading Coefficient Test to determine the right-hand and left-hand behavior of the graph of the polynomial function

15
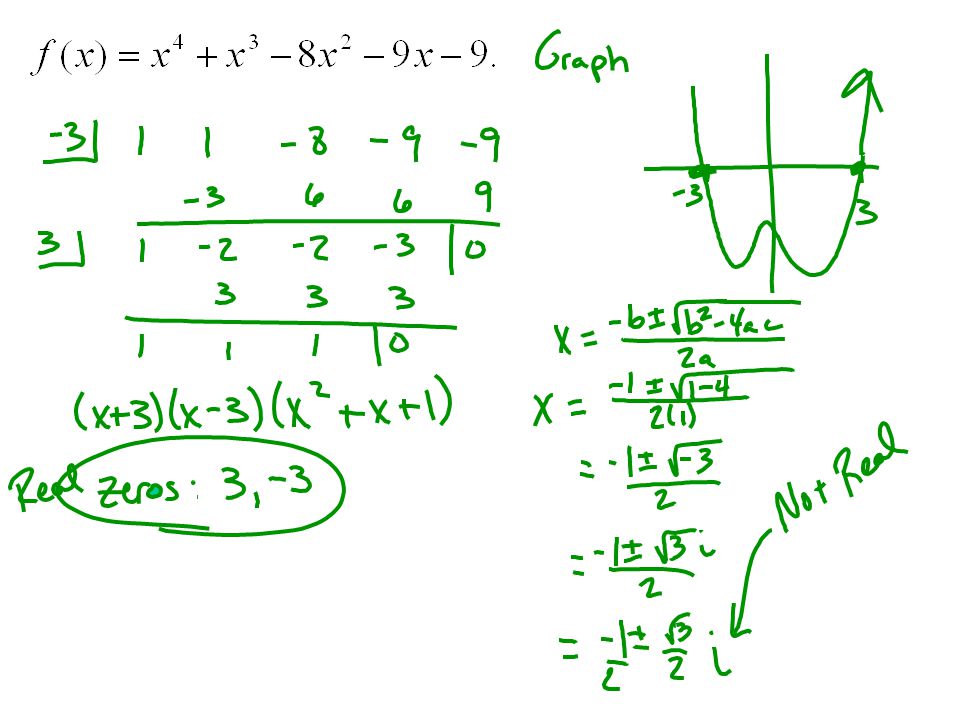
#6 Find all the real zeros of Verify your answer with a graphing utility.

17
#7 Find a polynomial function with 0, 3, and -2 as zeros.

18
0, 3, and -2 as zeros.

19
#8 Sketch by hand.

21
#9 Divideby x - 3 using long division.

22
x - 3

23
#10 Divide by

25
#11 Use synthetic division to divide by x + 5.

26
x + 5

27
#12 Use synthetic division to find f(-6) when
 when")
28
f(-6)
")
29
#13 Find the real zeros of

31
#14 Find the real zeros of

33
#15 List all possible rational zeros of the function

35
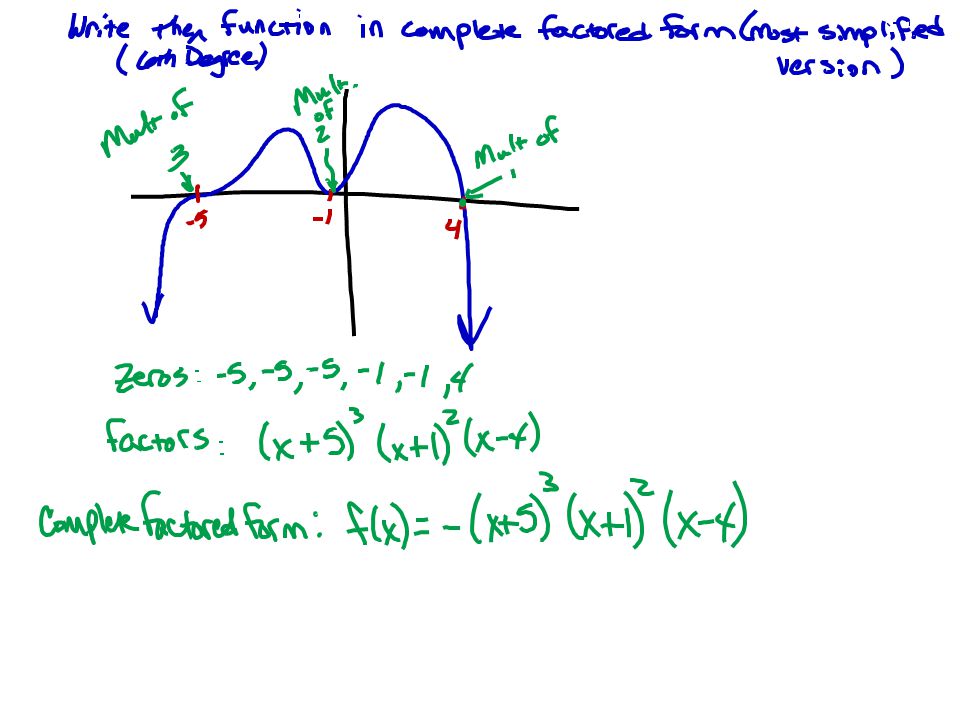
#16 Write as a product of linear factors.

37
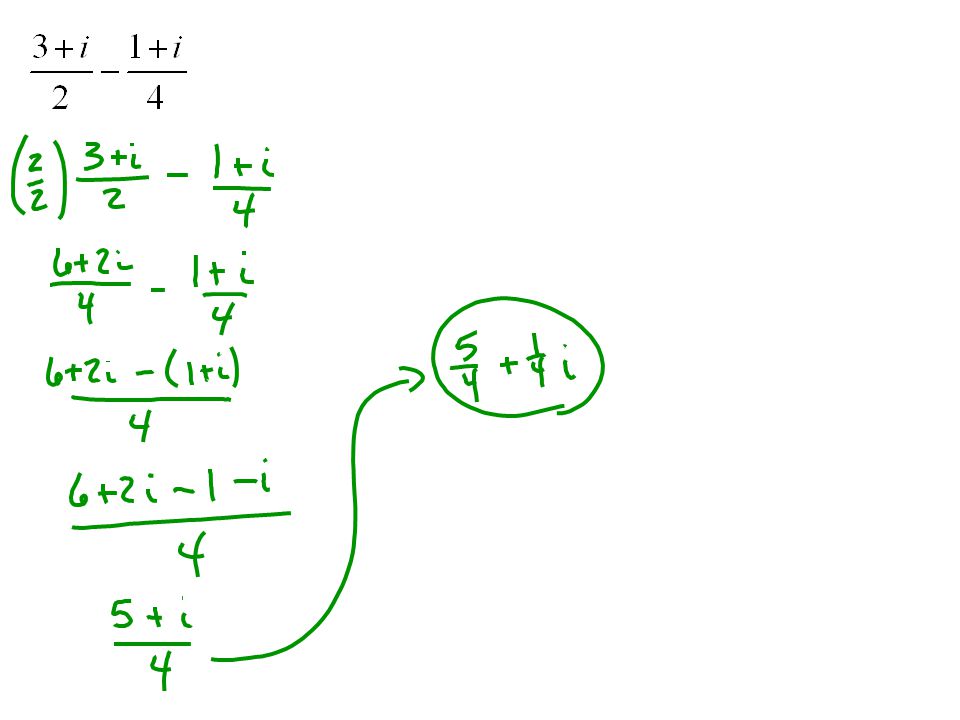
#17 Write in standard form.

39
#18 Writein standard form.

41
#19 Find a polynomial with real coefficients that has 2, 3 + i, and 3 - 2i as zeros.

42
2, 3 + i, and 3 - 2i as zeros

43
#20 Use synthetic division to show that 3i is a zero of

44
3i

45
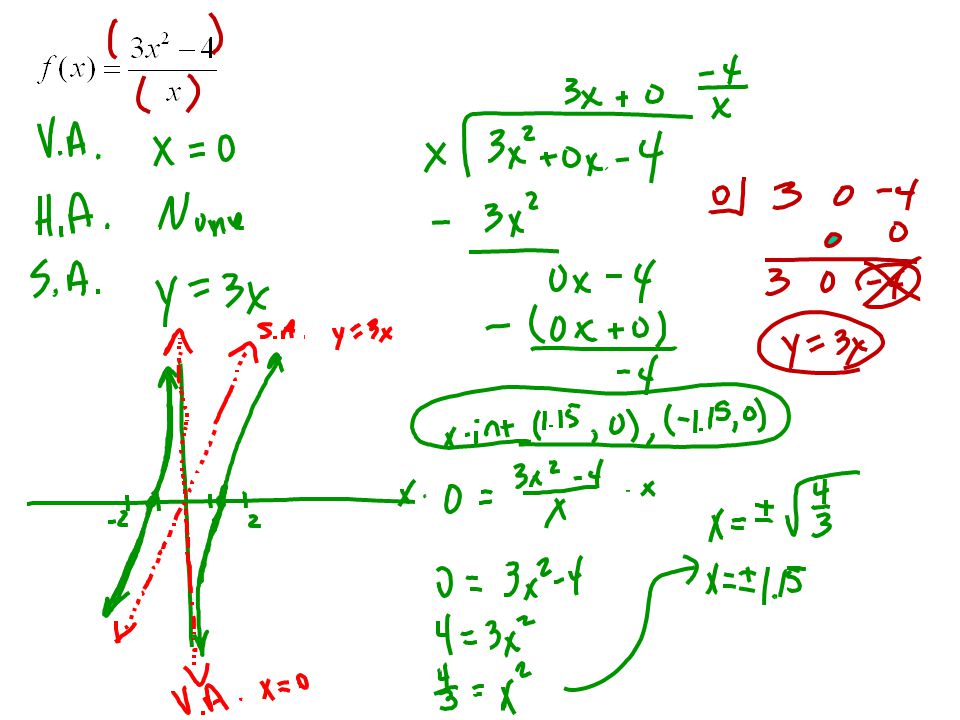
#21 Sketch the graph of and label all intercepts and asymptotes.

47
#22 Sketch the graph of and label all intercepts and asymptotes.

49
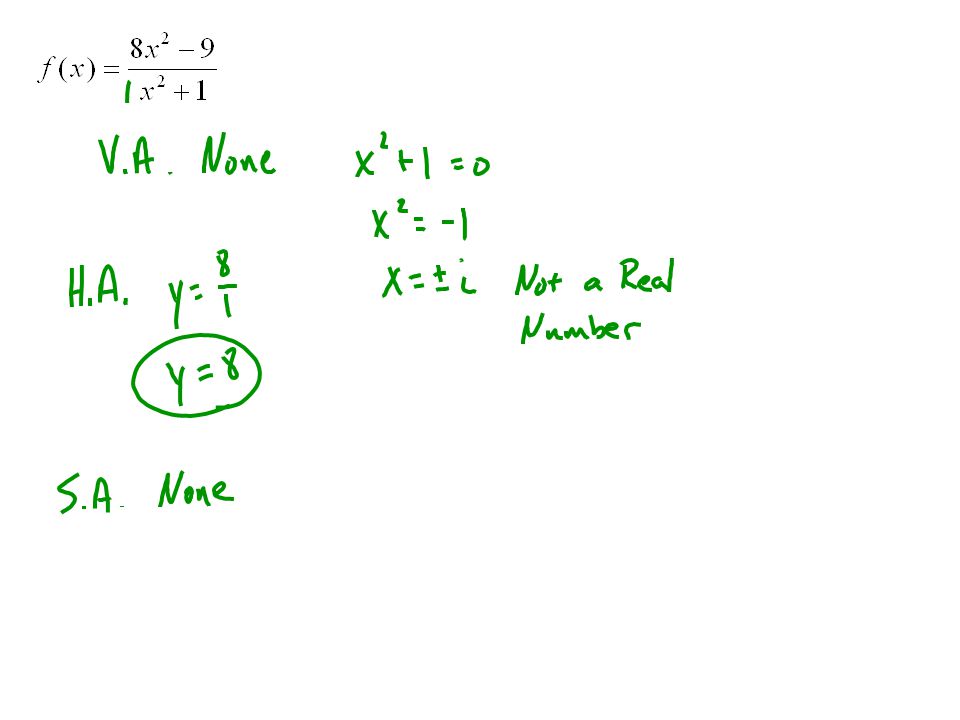
#23 Find all the asymptotes of

51
#24 Find all the asymptotes of

53
#25 Sketch the graph of

Similar presentations


 List all possible rational zeros of this polynomial: 5x 4 – 31x 3 + 11x 2 – 31x + 6 p 1, 2, 3, 6 q 1, 5 p 1, 2,>")


 No Calculator Please 1) For the function find: a)Vertical Asymptotes and holes b) Horizontal (or) Slant Asymptotes c) X-intercepts.>")


