Download presentation
Presentation is loading. Please wait.

1
Calibration of Sunspot Numbers Leif Svalgaard Stanford University leif@leif.org Eddy Symposium 22 Oct. 2010

2
Waldmeier’s Description of What he Believed was the Counting Method Waldmeier, 1961 I believe (2) is incorrect, having read all Wolfer’s [and Brunner’s] papers and not found any such description. Waldmeier may have believed that the spots were weighted by size and carried that belief into his count.
![Waldmeier’s Description of What he Believed was the Counting Method Waldmeier, 1961 I believe (2) is incorrect, having read all Wolfer’s [and Brunner’s] papers and not found any such description.](http://images.slideplayer.com/13/3736904/slides/slide_2.jpg "Waldmeier may have believed that the spots were weighted by size and carried that belief into his count..")
3
Waldmeier’s Own Description of his [?] Counting Method 1968 Can we see this in the Historical Record?
![Waldmeier’s Own Description of his [ ] Counting Method 1968 Can we see this in the Historical Record](http://images.slideplayer.com/13/3736904/slides/slide_3.jpg "Waldmeier’s Own Description of his [ ] Counting Method 1968 Can we see this in the Historical Record")
4
This is still the basis for the SSN 2010-8-27 2010-9-13 2010-4-22 2003-10-30 Locarno is the Reference station for SIDC Group # | weighted count Has been observing 50+ years

5
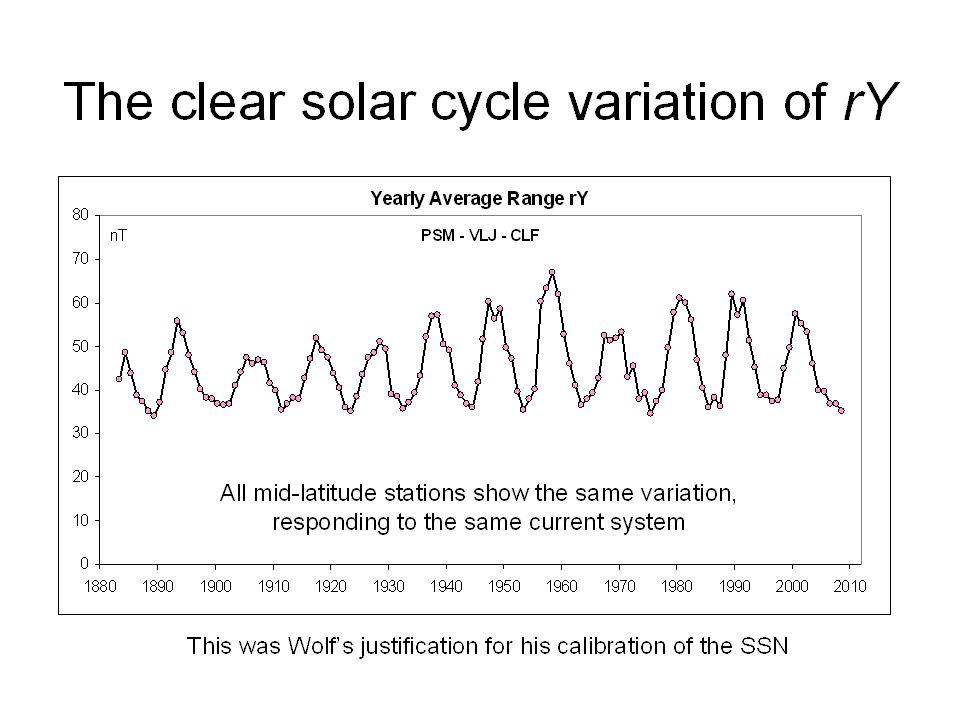
Wolf’s Discovery: rD = a + b R W. H North X D Y = H sin(D) dY = H cos(D) dD For small dD rY Morning Evening East Y rD A current system in the ionosphere is created and maintained by solar FUV radiation Wolf realized that this relation can be used to check the sunspot calibration
 dY = H cos(D) dD For small dD rY Morning Evening East Y rD A current system in the ionosphere is created and maintained by solar FUV radiation Wolf realized that this relation can be used to check the sunspot calibration.")
7
Using rY from nine ‘chains’ of stations we find that the correlation between F10.7 and rY is extremely good (more than 98% of the variation is accounted for) This establishes that Wolf’s procedure and calibration are physically sound
 This establishes that Wolf’s procedure and calibration are physically sound")
8
The diurnal range rY is thus an extremely good proxy for the F10.7 radio flux and [presumably] for ‘solar activity’ in general Here is the response at Helsinki and at its replacement station Nurmijärvi Note, that activity in the 1840s-1870s was similar to that in the 1970s-2000s
![The diurnal range rY is thus an extremely good proxy for the F10.7 radio flux and [presumably] for ‘solar activity’ in general Here is the response at Helsinki and at its replacement station Nurmijärvi Note, that activity in the 1840s-1870s was similar to that in the 1970s-2000s](http://images.slideplayer.com/13/3736904/slides/slide_8.jpg "The diurnal range rY is thus an extremely good proxy for the F10.7 radio flux and [presumably] for ‘solar activity’ in general Here is the response at Helsinki and at its replacement station Nurmijärvi Note, that activity in the 1840s-1870s was similar to that in the 1970s-2000s")
9
The Waldmeier Discontinuity, I Waldmeier’s counts are 22% higher than Wolfer and Brunner’s, for the same amplitude of the Diurnal Geomagnetic Variation.

10
The Waldmeier Discontinuity, II

11
The Group Sunspot Number R G is derived from the RGO data after ~1874, so should show the same discontinuity, and it does: Note, that I plot the inverse ratio, thus R Z after 1945 is about 20% too high I’ll come back to this discontinuity a bit later …

12
The Waldmeier Discontinuity, III From ~40,000 CaK spectroheliograms from the 60-foot tower at Mount Wilson between 1915 and 1985 a daily index of the fractional area of the visible solar disk occupied by plages and active network has been constructed [Bertello et al., 2008]. Monthly averages of this index is strongly correlated with the sunspot number. The relationship is not linear, but can be represented by the following equation: R = [(CaK – 0.002167)*8999] 1.29 using data from 1910-1945, i.e. the pre-Waldmeier era. The SSN observed by Waldmeier is 20% higher than that calculated from CaK using the pre-Waldmeier relation.
![The Waldmeier Discontinuity, III From ~40,000 CaK spectroheliograms from the 60-foot tower at Mount Wilson between 1915 and 1985 a daily index of the fractional area of the visible solar disk occupied by plages and active network has been constructed [Bertello et al., 2008].](http://images.slideplayer.com/13/3736904/slides/slide_12.jpg "Monthly averages of this index is strongly correlated with the sunspot number. The relationship is not linear, but can be represented by the following equation: R = [(CaK – )*8999] 1.29 using data from , i.e. the pre-Waldmeier era. The SSN observed by Waldmeier is 20% higher than that calculated from CaK using the pre-Waldmeier relation..")
13
The Waldmeier Discontinuity, IV The value of the Ionospheric Critical Frequency foF2 depends strongly on solar activity. The slope of the correlation changed 20% between sunspot cycle 17 and 18 when Waldmeier took over.

14
If we accept the fidelity of the RGO sunspot observations [at least for a few decades around 1945] we must ascribe the artificial increase of Rz after 1945 to Waldmeier’s inexperience [Friedli, 2005] as he struggled with learning how to construct the sunspot number [introducing the weights?]. Subsequent observers have strived to match Waldmeier, so in order to remove the 1945 discontinuity [and be consistent with modern counts] we must increase the pre-1945 Rz by ~20%: This, of course, just makes the discrepancy with the Group Spot Number worse [ ~ 1.4 before 1875].
![If we accept the fidelity of the RGO sunspot observations [at least for a few decades around 1945] we must ascribe the artificial increase of Rz after 1945 to Waldmeier’s inexperience [Friedli, 2005] as he struggled with learning how to construct the sunspot number [introducing the weights ].](http://images.slideplayer.com/13/3736904/slides/slide_14.jpg "Subsequent observers have strived to match Waldmeier, so in order to remove the 1945 discontinuity [and be consistent with modern counts] we must increase the pre-1945 Rz by ~20%: This, of course, just makes the discrepancy with the Group Spot Number worse [ ~ 1.4 before 1875]..")
15
Wolf himself was not afraid of such wholesale adjustments

16
Rudolf Wolf’s ‘Relative’ Sunspot Number values change over time… SIDC 2009 1837 138.3 25% higher Rudolf Wolf 1861 1837 111.0 Different ! Wolf started his own observations in 1849

17
Even GSN has been ‘adjusted’

18
The Group Sunspot Number R G is derived from the RGO data after ~1874 Note, that I plot the inverse ratio, thus R G before ~1880 is about 40% too low I’m back at this discontinuity as promised…

19
The Discontinuity in the 1880s between Group and Zurich Sunspot Numbers, I

20
For each station we now compute the average,, and diurnal range [converted to force units, nT, from arc minutes] and plot against the range [blue diamonds, left]. You can see Wolf’s linear relationship in action. For the eight stations with data after 1880, the s are also plotted [pink dots] and they match the points reasonably well. This is, however, not the case for the eleven stations from 1850 and before. Their [red diamonds] lie well below the fitted line. To make them fit it suffices to multiply their values by 1.4 [giving red open diamonds]. The Discontinuity in the 1880s between R G and R Z explained and resolved
![For each station we now compute the average,, and diurnal range [converted to force units, nT, from arc minutes] and plot against the range [blue diamonds, left].](http://images.slideplayer.com/13/3736904/slides/slide_20.jpg "You can see Wolf’s linear relationship in action. For the eight stations with data after 1880, the s are also plotted [pink dots] and they match the points reasonably well. This is, however, not the case for the eleven stations from 1850 and before. Their [red diamonds] lie well below the fitted line. To make them fit it suffices to multiply their values by 1.4 [giving red open diamonds]. The Discontinuity in the 1880s between R G and R Z explained and resolved.")
21
Waldmeier [1971] already noticed that the tight correlation between the solar microwave flux F10.7 and the sunspot number could be used as a calibration tool Waldmeier: “As long as this relation holds, the Zürich series of sunspot-numbers may be considered to be homogeneous. If this relation should be subject to changes in the time to come, then the reduction factor used hitherto ought to be changed in such a way that the old R-F relation is reestablished”
![Waldmeier [1971] already noticed that the tight correlation between the solar microwave flux F10.7 and the sunspot number could be used as a calibration tool Waldmeier: As long as this relation holds, the Zürich series of sunspot-numbers may be considered to be homogeneous.](http://images.slideplayer.com/13/3736904/slides/slide_21.jpg "If this relation should be subject to changes in the time to come, then the reduction factor used hitherto ought to be changed in such a way that the old R-F relation is reestablished .")
22
The change in relationship is perhaps clearer in monthly values We know that the F10.7 measurements themselves [which are absolute flux values] have not changed because of the agreement between Canadian [since 1947] and Japanese [since 1951] measurements.
![The change in relationship is perhaps clearer in monthly values We know that the F10.7 measurements themselves [which are absolute flux values] have not changed because of the agreement between Canadian [since 1947] and Japanese [since 1951] measurements.](http://images.slideplayer.com/13/3736904/slides/slide_22.jpg "The change in relationship is perhaps clearer in monthly values We know that the F10.7 measurements themselves [which are absolute flux values] have not changed because of the agreement between Canadian [since 1947] and Japanese [since 1951] measurements.")
23
Comparing Observed and Synthetic SSN from F10.7 The growing discrepancy could be due to a drift in the SIDC calibration or to a real change in the Sun, or both! Waldmeier did not consider the possibility of a solar change… Do we?

24
Some other organizations that have kept a keen eye on the Sun, making their own sunspot number series:

25
All these series can be successfully scaled to SIDC before ~2001 But the same scaling relation yields a sunspot number after that time that is systematically 12% higher than SIDC’s. Did all these organizations somehow change their procedures and/or observer cadre? Or did SIDC?

26
It seems that we increasingly see ‘fewer spots’ for the same amount of microwave flux. We can quantify that by the ratio between observed spots and expected spots from the pre-1991 relationship: Monthly means when R>4 Adding 12% [assuming that SIDC has a problem from ~2001] does not materially alter this conclusion (red crosses).
..")
27
Conclusions The current sunspot number is not correctly calibrated. SIDC ‘undercounts’ since 2001 Waldmeier introduced an artificial upwards jump ~1945 The Group Sunspot Number is too low before ~1880. There is no long-term change in the SSN since 1700. No ‘Modern Grand Maximum’ Sunspots are becoming harder to see and may become effectively ‘invisible’ in a few years

Similar presentations


![The Solar Radio Microwave Flux and the Sunspot Number Leif Svalgaard Stanford University, Stanford, CA, USA. [http://leif.org/research] Hugh S Hudson University.](/13/3873114/big_thumb.jpg "The Solar Radio Microwave Flux and the Sunspot Number Leif Svalgaard Stanford University, Stanford, CA, USA. [http://leif.org/research] Hugh S Hudson University.>")


 Lean et al.,>")


