Download presentation
Presentation is loading. Please wait.

1
Common Core New Hampshire Department of Education November 18, 2011

2
Summer 2010

4
Remember eight points

5
Point #1: Common Core State Standards Solve Three Specific Problems

6
Problem #1: Increased Skills Demand and Competition

7
Source: Carnevale, Anthony P. et al. (June 2010). Help Wanted: Projections of Jobs and Education Requirements Through 2018. Georgetown Center on Education and the Workforce. ww9.georgetown.edu/grad/gppi/hpi/cew/pdfs/FullReport.pdf Jobs in Today’s (and Tomorrow’s) Workforce Require More Education and Training
 Workforce Require More Education and Training.")
8
8 Sources: Carnevale, Anthony P. and Donna Desrochers (2003). Standards for What? The Economic Roots of K-12 Reform. Education Testing Services. http://www.learndoearn.org/For-Educators/Standards-for-What.pdf ; Skills to Compete. http://www.skills2compete.org National Center for Higher Education Management Systems, analysis of 2009 American Community Survey. http://www.higheredinfo.org In 1950, 60% of jobs were classified as unskilled, attainable by young people with high school diplomas or less. Today, less than 20% of jobs are considered to be unskilled.

9
9 Sources: Carnevale, Anthony P. and Donna Desrochers (2003). Standards for What? The Economic Roots of K-12 Reform. 83% of New Hampshire’s jobs are middle- or high-skill (jobs that require some postsecondary education or training). Between 2008 and 2018, new jobs in New Hampshire requiring postsecondary education and training will grow by 53,000 while jobs for high school graduates and dropouts will grow by 22,000.
. Between 2008 and 2018, new jobs in New Hampshire requiring postsecondary education and training will grow by 53,000 while jobs for high school graduates and dropouts will grow by 22,000..")
10
10 Sources: Carnevale, Anthony P. and Donna Desrochers (2003). Between 2008 and 2018, New Hampshire will create 223,000 job vacancies both from new jobs and from job openings due to retirement. 141,000 of these job vacancies will be for those with postsecondary credentials, 67,000 for high school graduates and 15,000 for high school dropouts.

11
11 Sources: Carnevale, Anthony P. and Donna Desrochers (2003). New Hampshire ranks 7th in terms of the proportion of its 2018 jobs that will require a Bachelor’s degree, and is 45th in jobs for high school dropouts. 64% of all jobs in New Hampshire (486,000 jobs) will require some postsecondary training beyond high school in 2018.
 will require some postsecondary training beyond high school in")
13
% of Citizens with Postsecondary Degrees Among OECD Countries, by Age Group (2006) 55-6445-5435-4425-34ALL (25-64) 1 U.S. (40%)Canada (44%)Canada (54%)Korea (58%)Canada (49%) 2 Canada (40%)Japan (43%)Japan (48%)Canada (56%)Japan (43%) 3 N.Z. (34%)U.S. (40%)Finland (44%)Japan (55%)U.S. (41%) 4 Finland (29%)N.Z. (38%)U.S. (43%)N.Z. (48%)N.Z. (40%) 5 Australia (28%)Finland (37%)Korea (43%)Norway (46%)Finland (37%) 6 Norway (28%)Australia (33%)N.Z. (40%)Ireland (45%)Korea (37%) 7 Switz. (27%)Denmark (32%)Norway (38%)Denmark (43%)Norway (36%) 8 U.K. (27%)Norway (32%)Australia (38%)Belgium (42%)Australia (36%) 9 Sweden (26%)Switz. (31%)Denmark (37%)Australia (42%)Denmark (34%) 10 Neth. (26%)Neth. (31%)Ireland (37%)U.S. (42%)Ireland (34%) 11 Denmark (26%)Iceland (30%)Switz. (36%)Sweden (41%)Switz. (34%) 12 Japan (26%)U.K. (30%)Iceland (36%)France (41%)U.K. (33%) 13 Germany (24%)Belgium (29%)Belgium (35%)Neth. (40%)Belgium (32%) 14 Iceland (24%)Sweden (28%)U.K. (33%)Spain (39%)Neth. (32%) 15 Belgium (22%)Ireland (27%)Sweden (33%)Luxembourg (39%)Sweden (32%) America’s International Edge is Slipping in Postsecondary Degree Attainment Source: OECD. Education at a Glance 2010. http://www.oecd-ilibrary.org/education/education-at-a-glance-2010_eag- 2010-en ; National Center for Higher Education Management Systems analysis of 2009 American Community Survey. http://www.higheredinfo.org
Canada (44%)Canada (54%)Korea (58%)Canada (49%) 2 Canada (40%)Japan (43%)Japan (48%)Canada (56%)Japan (43%) 3 N.Z. (34%)U.S. (40%)Finland (44%)Japan (55%)U.S. (41%) 4 Finland (29%)N.Z. (38%)U.S. (43%)N.Z. (48%)N.Z. (40%) 5 Australia (28%)Finland (37%)Korea (43%)Norway (46%)Finland (37%) 6 Norway (28%)Australia (33%)N.Z. (40%)Ireland (45%)Korea (37%) 7 Switz. (27%)Denmark (32%)Norway (38%)Denmark (43%)Norway (36%) 8 U.K. (27%)Norway (32%)Australia (38%)Belgium (42%)Australia (36%) 9 Sweden (26%)Switz. (31%)Denmark (37%)Australia (42%)Denmark (34%) 10 Neth. (26%)Neth. (31%)Ireland (37%)U.S. (42%)Ireland (34%) 11 Denmark (26%)Iceland (30%)Switz. (36%)Sweden (41%)Switz. (34%) 12 Japan (26%)U.K. (30%)Iceland (36%)France (41%)U.K. (33%) 13 Germany (24%)Belgium (29%)Belgium (35%)Neth. (40%)Belgium (32%) 14 Iceland (24%)Sweden (28%)U.K. (33%)Spain (39%)Neth. (32%) 15 Belgium (22%)Ireland (27%)Sweden (33%)Luxembourg (39%)Sweden (32%) America’s International Edge is Slipping in Postsecondary Degree Attainment Source: OECD. Education at a Glance en ; National Center for Higher Education Management Systems analysis of 2009 American Community Survey.")
15
Problem #2: Students Not College/Career Ready

16
Over 40% of employers rate new entrants out of high school as “deficient” (based on an assessment of 21 st century skills: work ethic, communication, collaboration, and critical thinking) in their for the entry- level jobs they typically fill. Source: Are they ready to work? Employers’ perspectives on the basic knowledge and applied skills of new entrants to the 21 st century U.S. workforce.

17
42%

18
65-70%

19
$1.3 Billion

20
$1.2 Million

21
37%

22
Half of the students taking the ACT meet benchmark for reading Source: Reading Between the Lines: What the ACT Reveals About College Readiness in Reading (http://www.act.org/research/policymakers/pdf/reading_summary.pdf)

23
20%

24
350L Gap Source: Gary Williamon 2006)(from Appendix A of the CCSS)
(from Appendix A of the CCSS)")
25
Problem #3: Variance Across the Country

26
46%

27
Point #1: Common Core State Standards Solve Three Specific Problems Increased competition Students not prepared Need for consistency

28
Point #2: Common Core State Standards Are Not A Federal Mandate

34
State-led Broad support

35
Point #3: Common Core State Standards Are Fewer, Clearer, and Higher

36
Criteria for New Standards Fewer, clearer, and higher (Consistent, rigorous, and shared aligned with college and work expectations) Aligned with college and work expectations Include rigorous content and application of knowledge through high-order skills Build upon strengths and lessons of current state standards (think DNA of education) Internationally benchmarked, so that all students are prepared to succeed in our global economy and society Based on evidence and research
 Aligned with college and work expectations Include rigorous content and application of knowledge through high-order skills Build upon strengths and lessons of current state standards (think DNA of education) Internationally benchmarked, so that all students are prepared to succeed in our global economy and society Based on evidence and research")
37
English Language Arts and Literacy Focus and coherence – Coherent progressions develop literacy skills across grade levels Focus on text complexity – Students required to read texts of increasing complexity College and career readiness in writing – Students required to write using evidence from informational reading. Literacy as a shared responsibility – Literacy skills in reading and writing included in history/social studies, science, and technical areas

38
Mathematics Focus and coherence – Focus on key topics t each grade level. – Coherent progressions across grade levels. Balance of concepts and skills – Content standards require both conceptual understanding and procedural fluency. Mathematic practices – Foster reasoning and sense making in mathematics. College and career readiness – Level is ambitious but achievable.

39
Format is Similar to NH

40
Text Complexity Increases

41
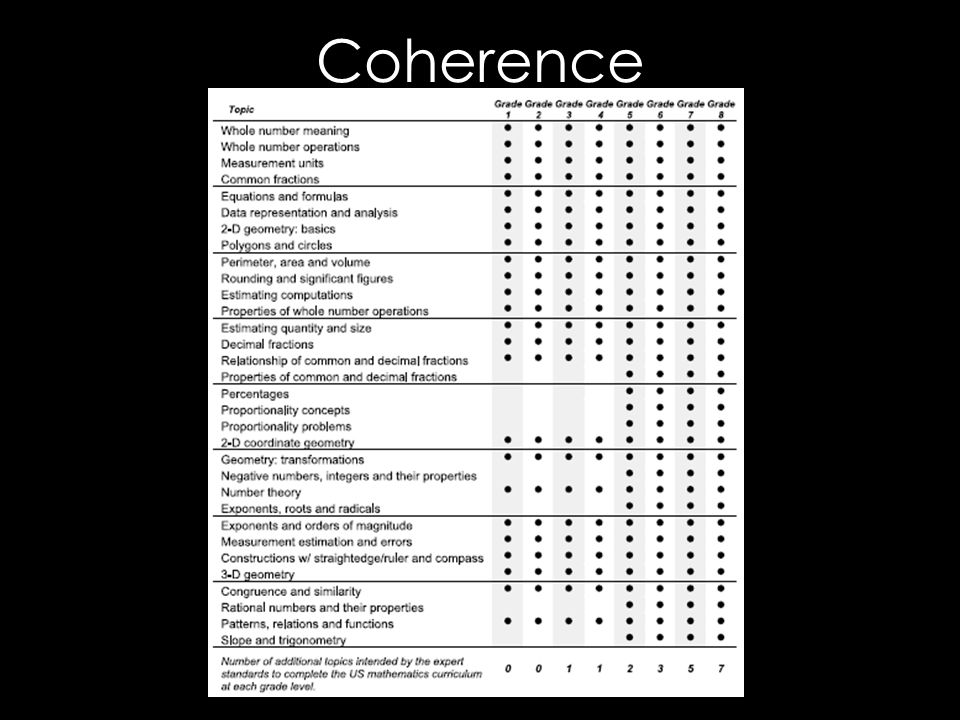
Coherence

43
Let’s Address the Claims for New Hampshire: Fewer, Clearer, Higher English Language ArtsMathematics FordhamK. HessFordhamPetit Fewer--No--Yes ClearerYesVariesYes HigherYesVariesYes

44
57%

45
Point #3: Common Core State Standards Are Fewer, Clearer, and Higher. Text increases in complexity. Math standards are more coherent (fewer topics)
.")
46
Point #4: Achieving on CCSS would significantly change our international standing.

47
Current U.S. Performance College and Career Readiness Standards College and Career Readiness in Mathematics Increased readiness of students meeting College and Career Benchmark

48
Internationally Competitive 7 th Estimated U.S. rank on PISA if students all students were college and career ready Source: ACT, Affirming the Goal

49
Point #4: Achieving on CCSS would significantly change our international standing.

50
Point #5: Districts in New Hampshire are fully adopting.

51
NH Districts: Phase in Implementation (n=64)
")
52
Support Suggestions Guidance on what to expect (e.g. timelines and transition) – “Give clear direction of the NECAP testing or National testing timeline.” Crosswalk between NECAP and CCSS – “Is there a side by side for the CCSS and NHDOE framework yet?” Professional Development – “Continue to offer professional development opportunities for implementation of CCSS in all areas.” Policy Support
 – Give clear direction of the NECAP testing or National testing timeline. Crosswalk between NECAP and CCSS – Is there a side by side for the CCSS and NHDOE framework yet Professional Development – Continue to offer professional development opportunities for implementation of CCSS in all areas. Policy Support.")
53
Point #5: Districts in New Hampshire are fully adopting.

54
Point #6: The target date for full implementation is Fall 2013*.

55
2011-20122012-20132013-20142014-2015 NH Standards for ELA and Math Teach NH Curriculum Frameworks for ELA and Math Begin to seriously map the grade level differences between NH and CCSS to plan for SY13-14 First full year for new standards to be used in classrooms Common Core fully implemented Common Core for ELA and Math Continue Review, using NH Toolkit – Begin implementatio n of K-2 standards. Begin to seriously map the grade level differences between NH and CCSS to plan for SY13-14. NECAP in Reading, Math, and Writing NECAP (fall) Smarter Balanced Assessment (spring) NECAP in ScienceNECAP (fall)
 Smarter Balanced Assessment (spring) NECAP in ScienceNECAP (fall).")
56
Fall 2013: Some changes to Math NECAP.

57
Point #6: The target date for full implementation is Fall 2013*. Current KG and 9 th graders will take SBA. Changes in Fall 2013

58
Point #7: Resources are available to support implementation.

62
Other resources are to come…

63
Additional Resources

65
http://commoncoretools.wordpress.com/
66
Common core app

68
Point #7: Resources are available to support implementation.

69
Point #8: Common Core is not necessarily significantly more expensive.

70
Text adoption Professional development Assessment Availability of Resources

71
Point #8: Common Core is not necessarily significantly more expensive.

72
To Learn More National Website: www.corestandards.org NH DOE Website: www.education.nh.gov/spotlight/ccss/index.htm Questions: Joe Miller - joseph.miller@doe.nh.us or 271-3594joseph.miller@doe.nh.us

Similar presentations


 Welcome PVMS Parents!>")


