Download presentation
Presentation is loading. Please wait.

1
Income Categories and Estimates of Insurance Status and Income American Community Survey 2008-2010

2
Income and Insurance estimates relevant to Medicaid Expansion and Exchange Subsidies Three ACA population categories: 0-138, 138-400, over 400% of federal poverty level. Under 138% of poverty-AI/ANs are vastly overrepresented and thus many will be eligible for Medicaid. No asset test Childless adults covered so 65% of newly eligible will be males. A % very similar to the general population (40-47%) are in the 138% to 400% of federal poverty level (no cost sharing up to 300%) A much smaller % of AI/ANs are in the category over 400% of the FPL (13% to 28%) in these 7 states.
 are in the 138% to 400% of federal poverty level (no cost sharing up to 300%) A much smaller % of AI/ANs are in the category over 400% of the FPL (13% to 28%) in these 7 states..")
3
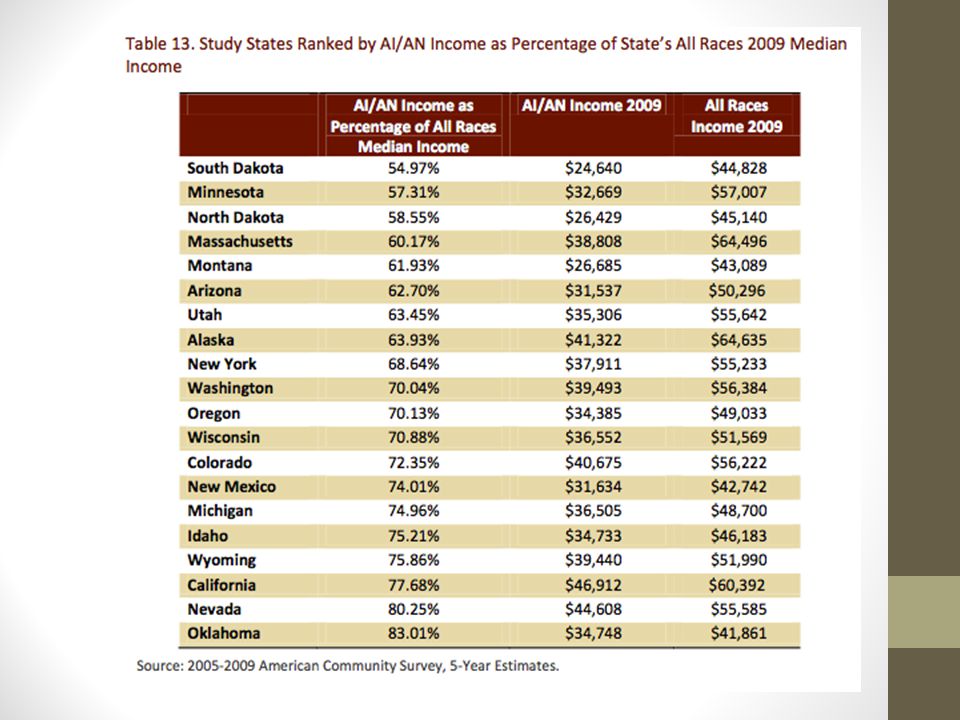
Lowest ACA poverty category is under 138% of poverty The following slide displays seven states ranked according to percentage of total Indian population under 138% of poverty It compares AI/AN population to the all races population Arizona, Minnesota, New Mexico and Oregon have over 40% of the AIAN population under 138% Minnesota has by far the greatest relative poverty depravation with a 25% difference in the percentage under 138% of poverty between AIAN and all races. Only North and South Dakota equal this degree of difference between Indian population and the state’s all races pop. OK and CA are nearly equal to the all races category in the percentage of the population under 138% of the federal poverty level. These data are consistent with the reported poverty levels depicted in the following table that compares AI/AN income to all races.

6
ACA income category for subsidies 138-400% of FPL The differential between AIAN and all races is exceedingly small (under 5%) in the seven states despite great variation in the distribution of income between AIANs and total population: The Reason? The explanation is because so many AIANs are under 138% of FPL not because of similar income distribution. That said, the subsidies will reach a large number of AI/ANs. All 7 states are between 40 and 47% of total AIAN population lie in this income category. Oklahoma has the highest percentage at 47%

9
ACA income category over 400% of Federal Poverty Level California and Washington have over ¼ their AIAN population over 400% of FPL and thus not eligible for subsidies. These are states with high cost of living that is not taken into account in determining subsidies. With the exception of CA and OK the % of the population over 400% differential between AIAN and all races exceeds 10%-In Minnesota 39% of the population is over 400% of poverty compared to just 17% of the AIAN population.

11
Missing Variable: Offers of Employment Sponsored Insurance There are NO estimates of number of AIANs who will be disqualified from access to subsidies because of access to employer coverage. AI/AN are subject to the Minimum Coverage Requirement They are exempt from penalties however. They are not eligible for charity care if they are not exempt from minimum coverage requirement (many low income are). If offered coverage that is affordable and meets minimum coverage requirements they are required to accept (and pay for insurance coverage) AND they are not eligible for subsidies in the exchange. This will reduce (perhaps dramatically) the number of currently uninsured AIANs who are eligible for subsidies. Rather than accept and pay for coverage for themselves or dependents (and therefore will not be eligible for subsidies) AIAN will rely on IHS whenever there is reasonable access to IHS services.
. If offered coverage that is affordable and meets minimum coverage requirements they are required to accept (and pay for insurance coverage) AND they are not eligible for subsidies in the exchange. This will reduce (perhaps dramatically) the number of currently uninsured AIANs who are eligible for subsidies. Rather than accept and pay for coverage for themselves or dependents (and therefore will not be eligible for subsidies) AIAN will rely on IHS whenever there is reasonable access to IHS services..")
12
Total AIAN-WA Total-AIAN OR Total-AIAN MN Total-AIAN CA Total-AIAN NM Total-AIAN AZ Total-AIAN OK under 138 67,836 45,647 44,102 205,352 59,353 157,360 162,578 138-400 77,350 46,335 37,533 268,691 60,660 134,052 228,304 over 400 47,989 23,567 17,015 184,165 16,378 43,301 91,977 Total 193,175 115,548 98,650 658,208 136,391 334,713 482,859 IHS-WA IHS-OR IHS-MN IHS-CA IHS-NM IHS-AZ IHS-OK under 138 19,238 9,515 13,346 20,501 59,353 89,441 97,423 138-400 21,366 9,732 10,020 27,904 60,660 71,125 138,949 over 400 9,855 3,800 3,973 13,495 16,378 17,226 48,924 Total 50,459 23,048 27,339 61,900 136,391 177,792 285,296 Uninsured-WA Uninsured OR Uninsured MN Uninsured CA Uninsured NM Uninsured AZ Uninsured OK under 138 20,743 16,538 10,900 55,576 37,893 49,288 59,262 138-400 17,379 12,171 8,039 59,716 37,608 43,174 61,786 over 400 4,877 2,295 2,721 16,877 8,642 8,141 13,052 Total 43,000 31,004 21,661 132,169 84,143 100,603 134,100 Medicaid-WA Medicaid-OR Medicaid-MN Medicaid-CA Medicaid-NM Medicaid-AZ Medicaid-OK under 138 36,111 21,046 26,650 105,017 42,168 89,523 72,956 138-400 16,702 7,428 8,937 55,624 18,250 32,205 37,046 over 400 2,726 1,190 715 9,251 2,247 3,860 3,485 Total 55,539 29,664 36,301 169,892 62,665 125,588 113,488 Medicare-WA Medicare-OR Medicare-MN Medicare-CA Medicare-NM Medicare-AZ Medicare-OK under 138 6,483 3,520 4,534 24,794 9,028 12,992 16,176 138-400 8,830 4,748 2,185 29,886 8,641 11,479 24,963 over 400 3,831 2,204 856 17,024 2,832 4,247 8,617 Total 19,144 10,472 7,575 71,704 20,501 28,718 49,756 Private-WA Private-OR Private-MN Private CA Private NM Private AZ Private OK under 138 11,697 8,688 7,977 45,163 8,802 18,293 28,772 138-400 43,436 26,688 21,001 152,573 36,291 58,163 126,347 over 400 41,278 19,970 13,463 157,716 20,204 30,390 74,486 Total 96,411 55,347 42,441 355,452 65,297 106,846 229,605

13
References Health Care Reform, Tracking Tribal, Federal and State Implementation, CMS May 2011 Health Care Reform California Rural Indian Health Board dataset of 2008-2010 American Community Survey. Health Care Reform: Measuring its impact on the Portland Area’s Uninsured American Indians & Alaska Natives Health Care Reform

Similar presentations