Download presentation
Presentation is loading. Please wait.

1
Oklahoma's People and Their Needs ____________________________________________________________________________ Demographics…Population Ebbs and Tides Maternal Care Projecting Into the Future: Oklahoma's People and Their Needs ____________________________________________________________________________ Snapshot One: Demographics…Population Ebbs and Tides Snapshot Two: Maternal Care Presented to the State Insurance Commission by The Community Service Council of Greater Tulsa Jan Figart, RN, MS, and Dan Arthrell, MA January 23, 2008

2
Oklahoma's People & Their Needs _______________________________ Demographics Projecting Into the Future: Oklahoma's People & Their Needs _______________________________ Snapshot One: Demographics Population Ebbs and Tides

3
Oklahoma Counties Prepared by the Community Service Council of Greater Tulsa for the Metropolitan Human Services Commission, January, 2008 File:Projecting into the Future Jan23 2008.ppt

4
Oklahoma’s Population Density by Census Tract Census 2000: Oklahoma Profile U.S. Department of Commerce Economics and Statistics Administration U.S. CENSUS BUREAU http://ftp2.census.gov/geo/maps/special/profile2k/OK_2K_Profile.pdf

5
Oklahoma Counties Counties that grew more than the state’s 59% growth between 1950 and 2005 Prepared by the Community Service Council of Greater Tulsa for the Metropolitan Human Services Commission, January, 2008 File:Projecting into the Future Jan23 2008.ppt

6
Oklahoma’s Population Shifts 34 of Oklahoma’s 77 counties lost population between 1950 and 2005 All but 4 counties had less than 25,000 population in 2005 Above OK Average of 59% Harmon Co. Metro Counties Delaware & Cherokee Cos. (NE Oklahoma) Tulsa & Oklahoma Counties Metro Counties Marshall Co. Prepared by the Community Service Council of Greater Tulsa for the Metropolitan Human Services Commission, January, 2008 File:Projecting into the Future Jan23 2008.ppt
 Tulsa & Oklahoma Counties Metro Counties Marshall Co. Prepared by the Community Service Council of Greater Tulsa for the Metropolitan Human Services Commission, January, 2008 File:Projecting into the Future Jan ppt.")
7
Oklahoma Employment Security Commissionhttp://www.oesc.state.ok.us/lmi/LMILaborForceMaps/Population/Age.pdf Median Age

8
While Oklahoma’s total population will grow at a relativity slow pace (+10.2%), the population 65 and over will increase by over 60% between 2007 and 2030 0-1718-6465 & Over Source: US Census Bureau, Population Estimates Program Prepared by the Community Service Council of Greater Tulsa for the Metropolitan Human Services Commission, October, 2007 85 & OverTotal
, the population 65 and over will increase by over 60% between 2007 and & Over Source: US Census Bureau, Population Estimates Program Prepared by the Community Service Council of Greater Tulsa for the Metropolitan Human Services Commission, October, & OverTotal")
9
Oklahoma Ranks Percent of People Age 85 and Over, 2006 StateRANK % Age 85 & Over Kansas7t2.2 Arkansas12t2 Missouri18t1.9 United States 1.8 Louisiana36t1.6 New Mexico36t1.6 Colorado46t1.3 Texas46t1.3 Percent of People Age 65 and over, 2006 StateRANK % Age 65 & Over Arkansas914.0 Missouri1313.5 Kansas1713.3 United States 12.4 New Mexico3911.7 Louisiana4011.6 Texas479.9 Colorado489.7 Oklahoma 19 13.2 Source: US Census Bureau, Population Estimâtes Program Survey - 2006 American Community Survey, 2006 Puerto Rico Community Survey Prepared by the Community Service Council of Greater Tulsa for the Metropolitan Human Services Commission, October, 2007 Oklahoma 25t 1.8 % 65 & over Range: Ranked # 1 Florida @ 16.8% to Alaska Ranked #51 @ 6.8% % 85 & over t = tie Range: Ranked #1 Florida & N. Dakota @ 2.6% to Alaska Ranked #51 @ 0.6% 65,571 451,139 People Over 65 and Over 85

10
Oklahoma Employment Security Commissionhttp://www.oesc.state.ok.us/lmi/LMILaborForceMaps/Population/Age.pdf Median Household Income

11
Oklahoma Employment Security Commissionhttp://www.oesc.state.ok.us/lmi/LMILaborForceMaps/Population/Age.pdf Percent Families Below Poverty

12
Oklahoma Employment Security Commissionhttp://www.oesc.state.ok.us/lmi/LMILaborForceMaps/Population/Age.pdf Percent Mothers with Children Under Age Six in the Labor Force

13
Oklahoma Employment Security Commissionhttp://www.oesc.state.ok.us/lmi/LMILaborForceMaps/Population/Age.pdf Percent Mothers with Children Ages 6-17 in the Labor Force

14
Oklahoma Employment Security Commissionhttp://www.oesc.state.ok.us/lmi/LMILaborForceMaps/Population/Age.pdf Percent High School Graduate or Higher Among Population 25 Years and Over

15
Oklahoma Employment Security Commissionhttp://www.oesc.state.ok.us/lmi/LMILaborForceMaps/Population/Age.pdf Percent Bachelor’s Degree or Higher Among Population 25 Years and Over

16
Percent Government Workers

17
Percent Working Outside State of Residence

18
Source: Census 2000 analyzed by the Social Science Data Analysis Network (SSDAN).Census 2000Social Science Data Analysis Network (SSDAN) Oklahoma’s Population Growth +9.9% +18.2% +4.0% +9.7%
.Census 2000Social Science Data Analysis Network (SSDAN) Oklahoma’s Population Growth +9.9% +18.2% +4.0% +9.7%")
19
Change in Number of People, 1990 to 2000 Note: Ft. Smith MSA Note: Dallas/Fort Worth MSA Note: Wichita MSA Prepared by the Community Service Council of Greater Tulsa for the Metropolitan Human Services Commission, January, 2008 File:Projecting into the Future Jan23 2008.ppt

20
Oklahoma Percent Change in Total Population, 1990 to 2000 Prepared by the Community Service Council of Greater Tulsa for the Metropolitan Human Services Commission, January, 2008 File:Projecting into the Future Jan23 2008.ppt

21
Oklahoma Percent Change 1990 to 2000 and Population Density, 1990 Prepared by the Community Service Council of Greater Tulsa for the Metropolitan Human Services Commission, January, 2008 File:Projecting into the Future Jan23 2008.ppt

22
Oklahoma Population Distribution, 2000 500,000 100,000 10,000 Fewer than 10,000 Number of People by County: Prepared by the Community Service Council of Greater Tulsa for the Metropolitan Human Services Commission, January, 2008 File:Projecting into the Future Jan23 2008.ppt

23
Percent Change in Population of the US, by State, 2000 to 2010

24
Percent Change in Population of the US, by State, 2010 to 2020

25
Percent Change in Population of the US, by State, 2020 to 2030

26
Percent Change in Population of the US, by State, 2000 to 2030

27
Total Population Projections 2007 - 2030 US Compared to Oklahoma by Year Oklahoma United States+20.8% +10.2% U.S. Source: U.S. Census Bureau, Population Division, Interim State Population Projections, 2005. Prepared by the Community Service Council of Greater Tulsa for the Metropolitan Human Services Commission, October, 2007 Oklahoma

28
Working Age Population Age 18-64 Projections 2007 - 2030, US and Oklahoma Oklahoma United States +9.2% -0.2% U.S. Source: U.S. Census Bureau, Population Division, Interim State Population Projections, 2005. Prepared by the Community Service Council of Greater Tulsa for the Metropolitan Human Services Commission, October, 2007 Oklahoma

29
Total Population Percent Change US Compared to Oklahoma by Single Year of Age 0-85+ Oklahoma Ages 34-47 decline Source: US Census Bureau, Population Estimates Program Prepared by the Community Service Council of Greater Tulsa for the Metropolitan Human Services Commission, October, 2007

30
Oklahoma Ranks Old-Age Dependency Ratio of the Total Population (geographies ranked by estimate) StateRankRatio Texas2 44.2 New Mexico6 42.3 Louisiana12 40.8 Kansas13 40.7 Arkansas16 40 United States 39.1 Missouri20t38.8 Colorado31 37.6 Source: US Census Bureau, Population Estimates Program Notes · The old-age dependency ratio is derived by dividing the population 65 and over by the 18-to-64 population and multiplying by 100. (t = tie) Age Dependency Ratio of the Total Population (geographies ranked by estimate) StateRankRatio Arkansas6t62.5 New Mexico6t62.5 Kansas12 61.6 Louisiana14t60.3 Missouri16 60.2 Texas17 60.1 United States 58.9 Colorado49 53 Source: US Census Bureau, Population Estimates Program Notes - The age dependency ratio is derived by dividing the combined under-18 and 65-and-over populations by the 18-to-64 population and multiplying by 100. (t = tie) Oklahoma 14 40.4 Oklahoma 11 61.8 Source: US Census Bureau, Population Estimates Program Prepared by the Community Service Council of Greater Tulsa for the Metropolitan Human Services Commission, October, 2007 File: Aging in OK Oct 18 2007.ppt Age Dependency Ratios
 Age Dependency Ratio of the Total Population (geographies ranked by estimate) StateRankRatio Arkansas6t62.5 New Mexico6t62.5 Kansas Louisiana14t60.3 Missouri Texas United States 58.9 Colorado49 53 Source: US Census Bureau, Population Estimates Program Notes - The age dependency ratio is derived by dividing the combined under-18 and 65-and-over populations by the 18-to-64 population and multiplying by 100. (t = tie) Oklahoma Oklahoma Source: US Census Bureau, Population Estimates Program Prepared by the Community Service Council of Greater Tulsa for the Metropolitan Human Services Commission, October, 2007 File: Aging in OK Oct ppt Age Dependency Ratios.")
31
Age Dependent Population (0-17 Plus 65 & Over) Compared to Work Age Population (Age 18-64) Projections 2007 – 2030 Oklahoma Oklahoma Age 18-64 Oklahoma Age Dependent 0-17 plus 64+ +26.9% -0.2% Source: U.S. Census Bureau, Population Division, Interim State Population Projections, 2005. Prepared by the Community Service Council of Greater Tulsa for the Metropolitan Human Services Commission, October, 2007 File:Aging in OK Oct 18 2007.ppt

32
Age Dependent Population (0-17 and over age 64) Projections 2007 – 2030 Oklahoma Oklahoma Age 65 and Over +59.9% Source: U.S. Census Bureau, Population Division, Interim State Population Projections, 2005. Prepared by the Community Service Council of Greater Tulsa for the Metropolitan Human Services Commission, October, 2007 File:Aging in OK Oct 18 2007.ppt +9.5% Oklahoma Age 0-17 years

33
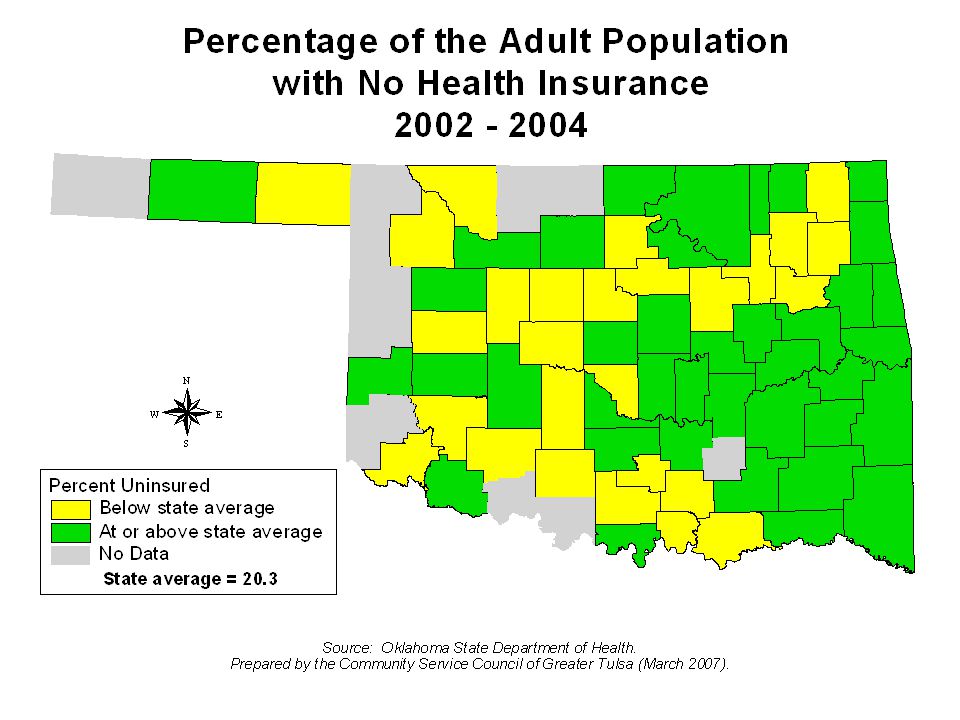
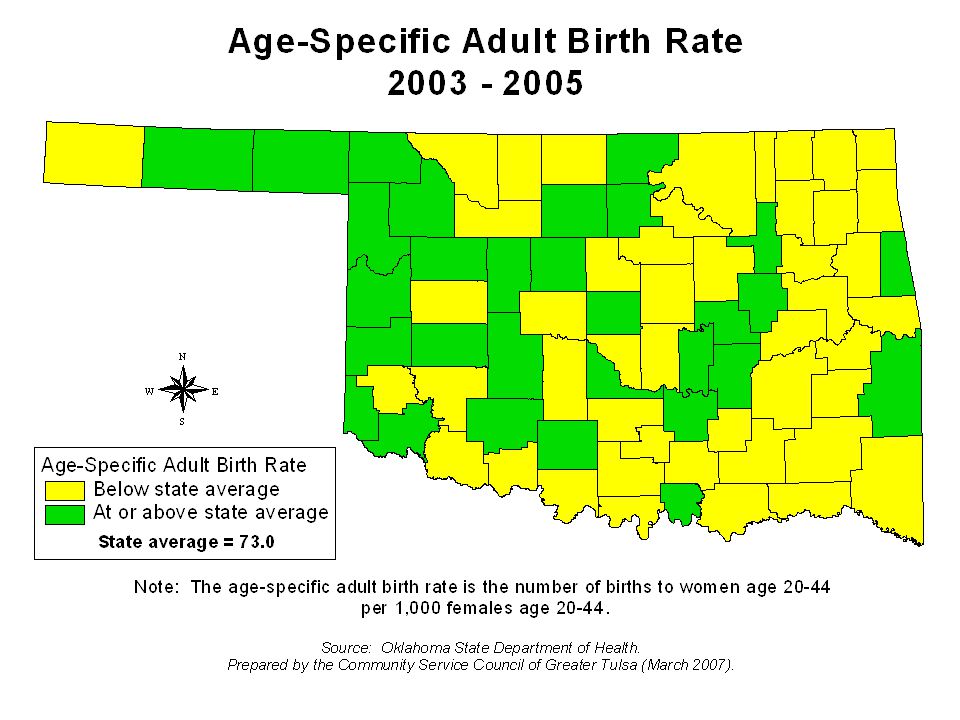
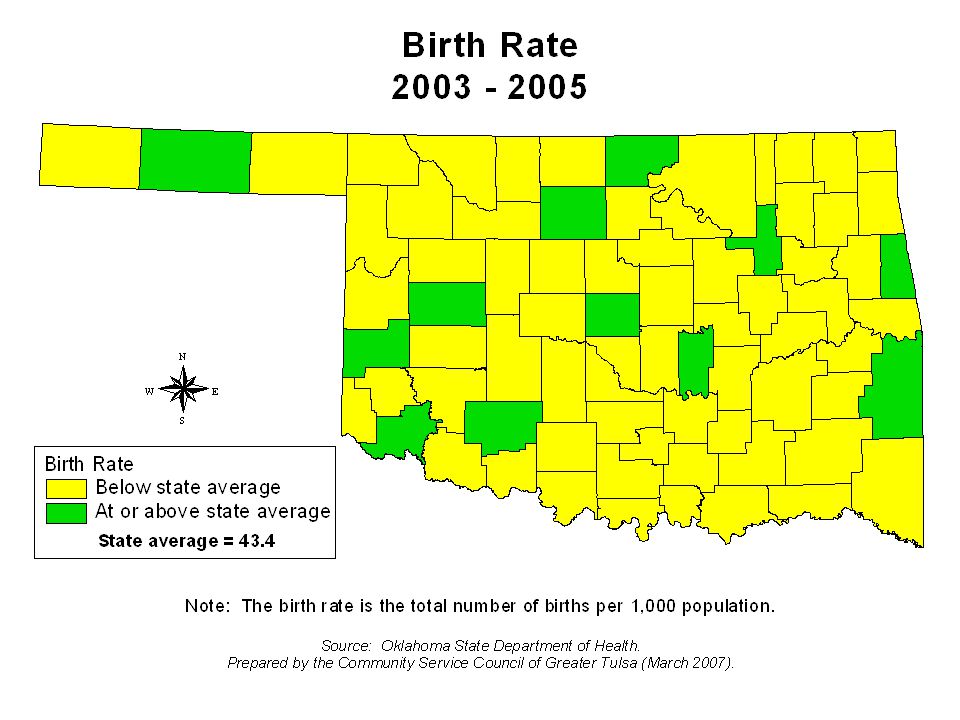
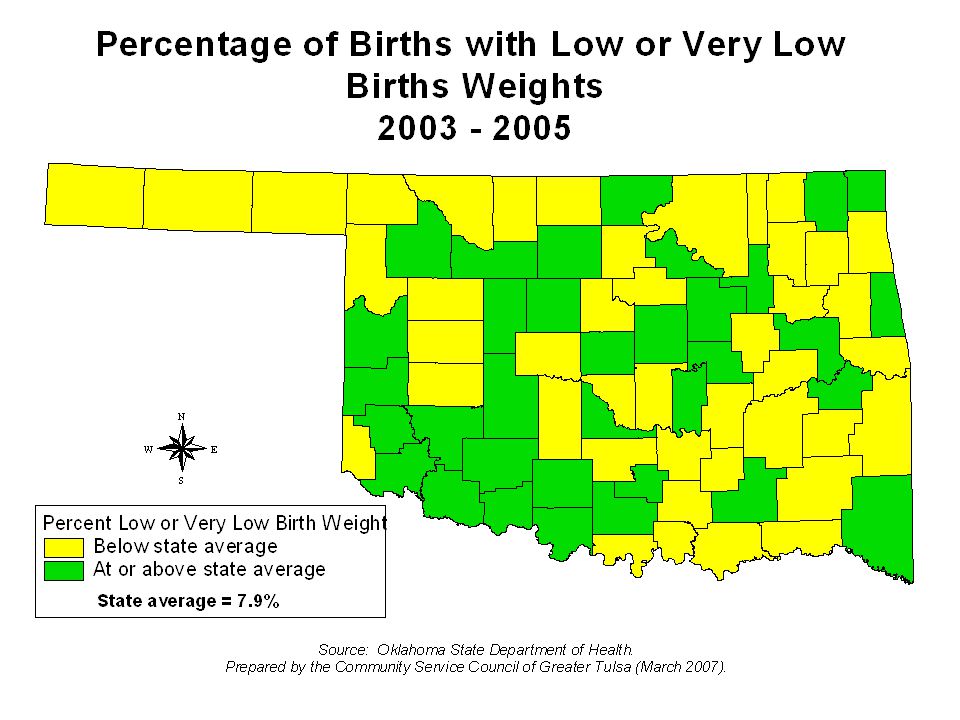
Oklahoma's People & Their Needs _______________________________ Maternal Care Projecting Into the Future: Oklahoma's People & Their Needs _______________________________ Snapshot Two: Maternal Care

52
The Community Service Council of Greater Tulsa appreciates the opportunity to share this information. We are available to provide a great amount of additional data and information on this topic and many others. The Community Service Council's Census Information Center (CIC) is provided in cooperation with the U.S. Census Bureau to make census data more accessible for use in planning to meet the needs of people in Oklahoma. Census Information Center (CIC) Please visit our website for a variety of presentations and sets of data for your use in planning and development of the State of Oklahoma. Go to www.csctulsa.org. Click on “Data” and “U.S. Census CIC.”www.csctulsa.org __________________________________________________________ Community Service Council of Greater Tulsa (a United Way agency) 16 East 16 th Street, Suite 202. Tulsa, OK 74119-4402. 918-585-5551 Contact: Dan Arthrelldarthrell@csctulsa.orgdarthrell@csctulsa.org Jan Figartjfigart@csctulsa.orgjfigart@csctulsa.org
 is provided in cooperation with the U.S. Census Bureau to make census data more accessible for use in planning to meet the needs of people in Oklahoma. Census Information Center (CIC) Please visit our website for a variety of presentations and sets of data for your use in planning and development of the State of Oklahoma. Go to Click on Data and U.S. Census CIC. __________________________________________________________ Community Service Council of Greater Tulsa (a United Way agency) 16 East 16 th Street, Suite 202. Tulsa, OK Contact: Dan Jan")
53
Oklahoma's People and Their Needs Demographics…Population Ebbs and Tides Maternal Care Projecting Into the Future: Oklahoma's People and Their Needs Snapshot One: Demographics…Population Ebbs and Tides Snapshot Two: Maternal Care Prepared for the State Coverage Initiative by The Community Service Council of Greater Tulsa January, 2008

Similar presentations


 June 2009.>")


 Source: U.S. Census Bureau,>")


