Download presentation
Presentation is loading. Please wait.

1
How Have Arkansas Students Been Performing? Keith Nitta University of Arkansas, Clinton School of Public Service April 22, 2008

2
Since the Arkansas Supreme Court’s 2002 Lake View decision: U.S. Department of Education has recognized Arkansas for rigorous curricular standards. Teacher pay raised to rank 32nd in the nation. Over $100 million a year for quality preschool. Arkansas ranked first in the nation in the quality of its early childhood educational standards. State per pupil funding for public education dramatically increased. Several hundred million dollars appropriated to improve school facilities. The 2000s: A Decade of Significant Educational Reform in Arkansas

3
Education Week ranked Arkansas 8th in the nation for overall educational quality. Education Week ranked Arkansas 8th in the nation for overall educational quality. From 2003 to 2007, Arkansas has been one of three states to improve on three of the four National Assessment of Educational Progress (NAEP) tests. Arkansas is now at or near national averages. From 2003 to 2007, Arkansas has been one of three states to improve on three of the four National Assessment of Educational Progress (NAEP) tests. Arkansas is now at or near national averages. The average ACT score for Arkansas students grew from 17 in 2001 to 21 in 2006, the most growth for any state testing at least half of its graduating seniors. The average ACT score for Arkansas students grew from 17 in 2001 to 21 in 2006, the most growth for any state testing at least half of its graduating seniors. Benefits to Public Education of Increased Attention and Investment
 tests. Arkansas is now at or near national averages. From 2003 to 2007, Arkansas has been one of three states to improve on three of the four National Assessment of Educational Progress (NAEP) tests. Arkansas is now at or near national averages. The average ACT score for Arkansas students grew from 17 in 2001 to 21 in 2006, the most growth for any state testing at least half of its graduating seniors. The average ACT score for Arkansas students grew from 17 in 2001 to 21 in 2006, the most growth for any state testing at least half of its graduating seniors. Benefits to Public Education of Increased Attention and Investment.")
4
Great Achievements, But Persistent Achievement Gap

5
Geographical Disparities in Graduation Rates, 2005-06* *Source: Community Level Information on Kids (CLIKS), Annie E. Casey Foundation. Provided by Arkansas Advocates for Children and Families

6
Racial Gaps in Graduation Rates White Students, 2005-06* *Source: Arkansas Department of Education, http://adedata.k12.ar.us/FY06_07http://adedata.k12.ar.us/FY06_07

7
Racial Gaps in Graduation Rates African American Students, 2005-06* *Source: Arkansas Department of Education, http://adedata.k12.ar.us/FY06_07http://adedata.k12.ar.us/FY06_07

8
Racial Gaps in Graduation Rates Latino Students, 2005-06* *Source: Arkansas Department of Education, http://adedata.k12.ar.us/FY06_07http://adedata.k12.ar.us/FY06_07

9
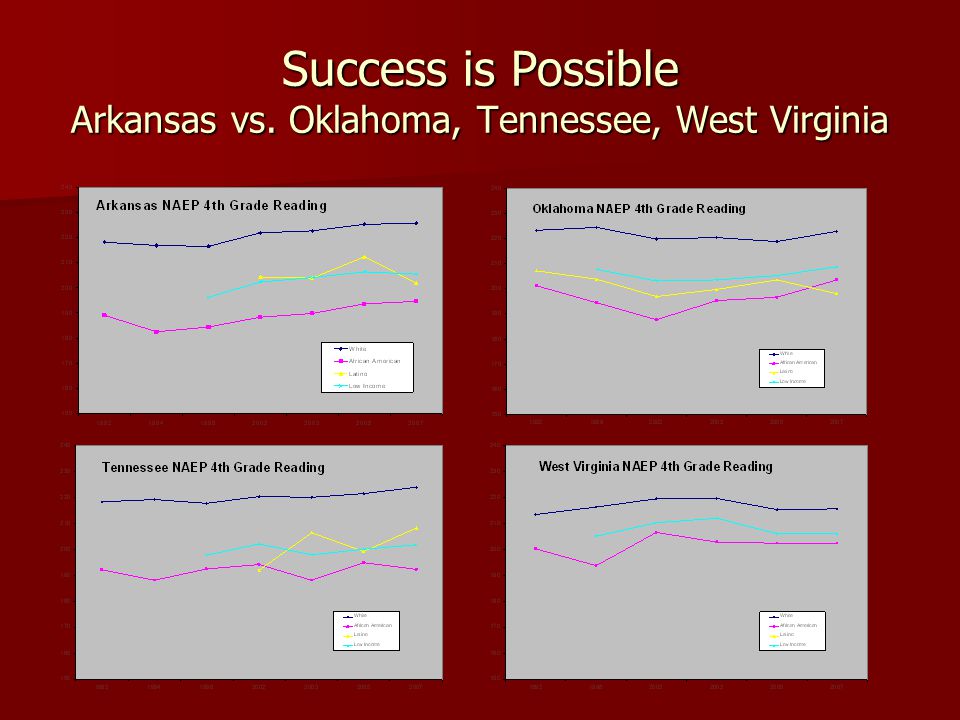
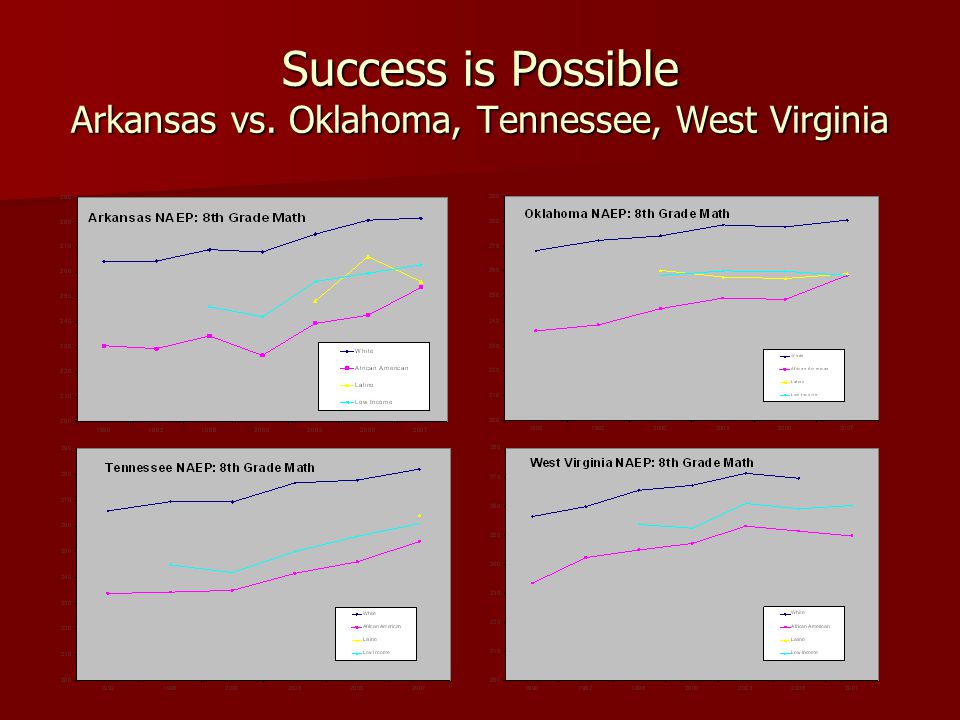
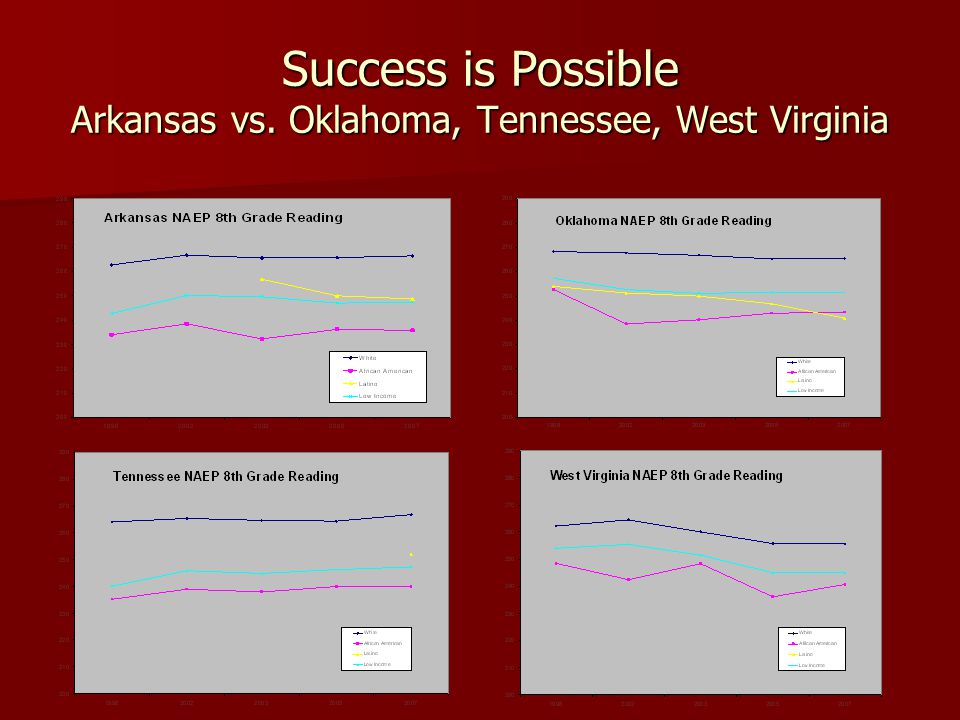
Success is Possible Arkansas vs. Oklahoma, Tennessee, West Virginia

13
Now What? Strategies to Close the Achievement Gap Build on the successes after Lake View to tackle the persistent achievement gap Build on the successes after Lake View to tackle the persistent achievement gap Success is possible Success is possible A holistic, multi-pronged approach A holistic, multi-pronged approach –After school and summer programs, school- based health clinics, pre-K, class-size reduction, community organizing, teacher quality, charter schools –Shared responsibility: state leaders, district leaders, school leaders, community leaders, parents, teachers, students, advocates

Similar presentations
>")


 5 th highest personal income (1) 12 th highest personal income per student (1) 48 th in combined.>")


