Download presentation
Presentation is loading. Please wait.

1
Evaluating Approaches to “Ecosystem Management” Using FVS Steve McConnell NWIFC August 29, 2002

2
Ecosystem Management Principles Multiple scales Ecosystem processes Humans Sustainability Biodiversity Boundaries Adaptive

3
Challenges Facing EM Tradeoffs remain unknown

4
Tradeoffs? volume species piece size variability predictability Timber Removed

5
Tradeoffs? snags old-growth relative density species composition Residual Landscape

6
Tradeoffs? bird habitat insects pathogens crown fire risk Ecological Changes

7
Demonstration Project Citizen partners Landscape planning Long history of management 60 years ago 10 years ago

9
Landscape Planning for Ecosystem Sustainability Develop a landscape planning method that: 1) incorporates social, economic and ecological considerations, and 2) integrates between stands and landscape
 incorporates social, economic and ecological considerations, and 2) integrates between stands and landscape")
10
Landscape Planning for Ecosystem Sustainability Identify landscape management zones Develop silvicultural Rx’s Quantify outcomes using the Forest Vegetation Simulation (FVS) model
 model")
11
Site Characteristics Warm moist forest at low elevation Very productive Diverse

12
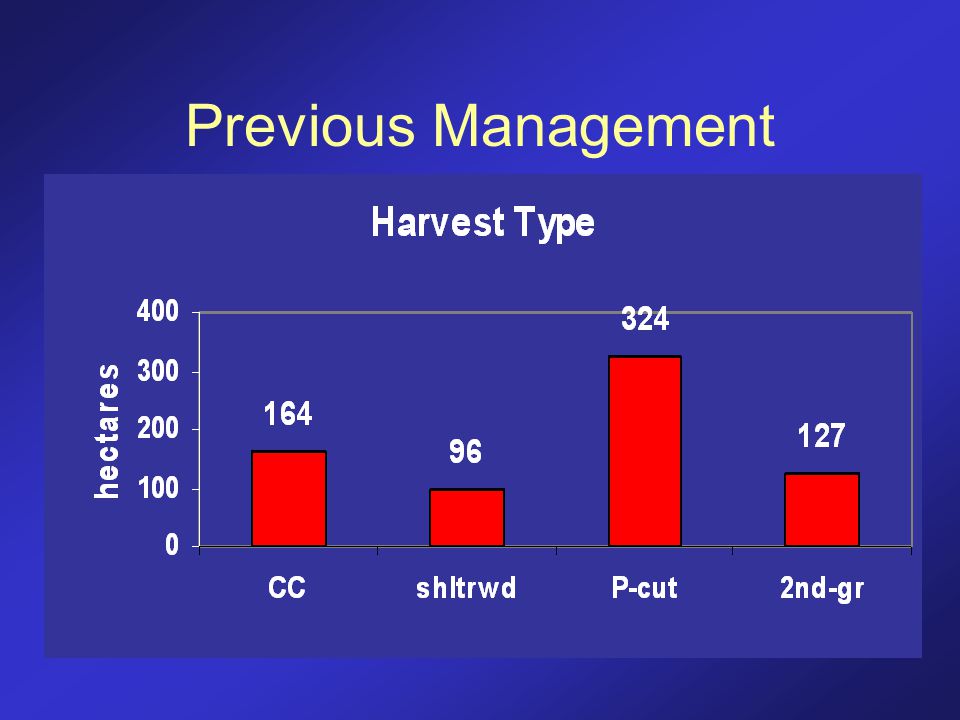
Previous Management

14
Change in Species Composition by Shade Tolerance Grouping

15
Diverse Social Values Recreation Roads and fire risk Visuals Old-growth Increase early seral Biological diversity Water quality Change (economic, population, social)
")
16
Plan With Citizen Partners, develop an EM approach Compare against a commodity and custodial approach

17
What Really Happened FACA All approaches can be part of an EM approach, scale-dependent Our EM ~ active approach to maintaining ecological integrity Conservative cutting approaches

18
Contrasting Management Scenarios Custodial: reserve Commodity: timber production Active: ecological integrity

19
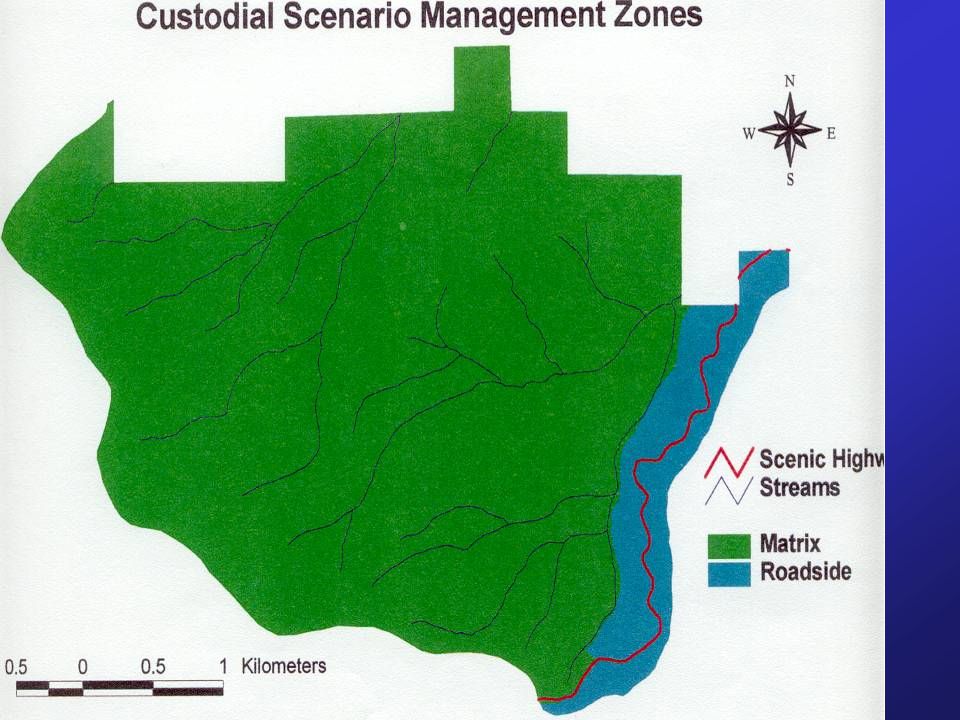
Custodial Scenario Objective: Reserve area Method: Monitor Practices: hazard tree removal along highway - cut 5% of trees 37m+ tall from stands adjacent to the highway

21
Commodity Scenario Objectives: Timber production / Area- regulated forest Method: Even-aged intensive management Practices: clearcut, overstory removal, commercial thinning, pre-commercial thinning, prescribed burning, planting

22
Commodity Scenario: Stand Priority for Clearcuts Relative density Basal area Merchantable bdft volume Species composition - % of basal area in shade-tolerant species Mortality/accretion ratio

23
Commodity Scenario: Stand Priority for Commercial Thinning Mortality/accretion ratio Relative density Species composition: % of basal area in shade-intolerant species Age (after year 20) - younger stands with higher priority Minimum 3000 bdft/acre
 - younger stands with higher priority Minimum 3000 bdft/acre")
25
Active Scenario Objective: Ecological integrity Method: Intensive partial cutting to direct structure and species composition Practices: partial cuts (35% maxim), conversion cuts (70-75%), composition control cuts, prescribed burning, planting
, conversion cuts (70-75%), composition control cuts, prescribed burning, planting")
26
Management Zones for Active Scenario 6 zones Current forest condition Biophysical site Connectivity Disturbance regimes Social values

27
Active Scenario LMZ Goals Dry-Ridge: Open stands with WL, PP Multi-Resource: Structurally diverse, older, mesic site tree species, reestablish western white pine Ridge: Brushfields, scattered dry-site trees

28
Active Scenario LMZ Goals Old-growth: Connected zone of old- growth conditions - structurally diverse, large trees Riparian: Functional, shade-intolerant trees Scenic Corridor: Protect visuals, avoid hazards, shade-intolerant trees

30
Active Scenario Prescription Generalizations Target shade-tolerant trees for cut Retain western larch Retain relict overstory trees Decrease relative density Plant shade-intolerant species Avoid windthrow Remove 20, 35, or 70% of basal area

31
LMZ Prescription Matrix

54
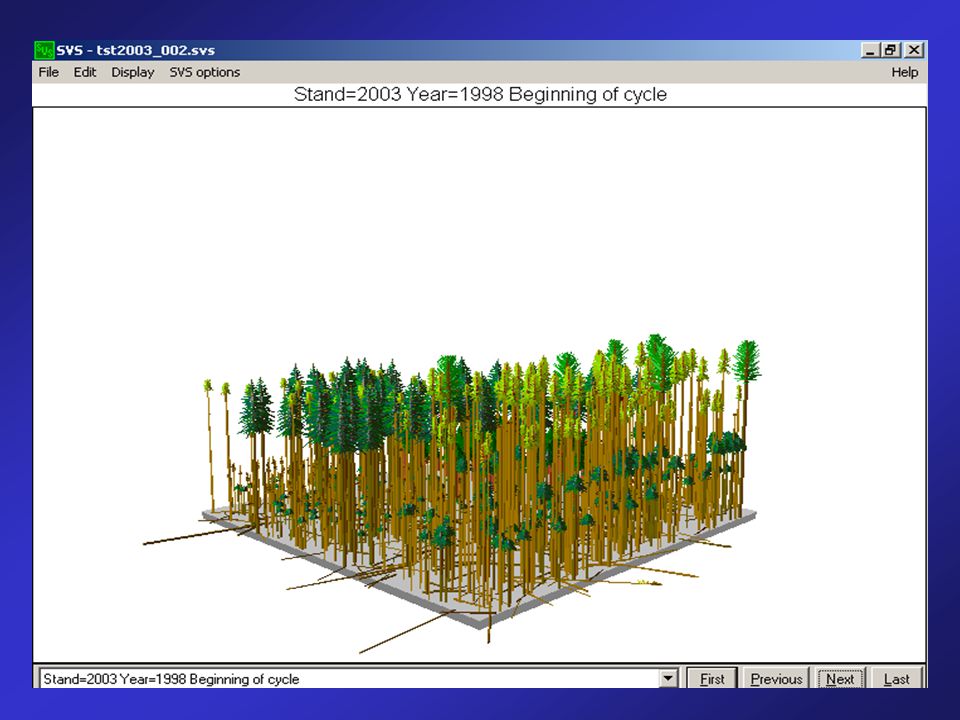
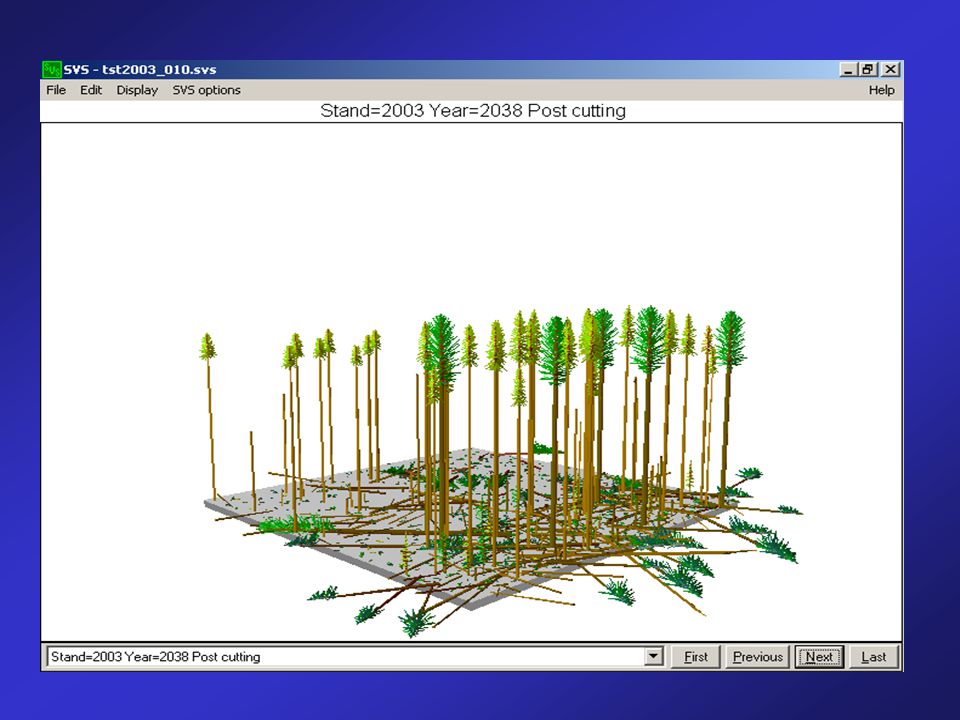
Using FVS 150 stands Projected for 60 Years Used Fire and Fuels Extension (pre- release version) Organized stands using SUPPOSE (version 1.12) Dumped data to EXCEL Spreadsheets
 Organized stands using SUPPOSE (version 1.12) Dumped data to EXCEL Spreadsheets")
55
Data Stand Exams (79%) Post-planting stocking surveys (9%) Pre-commercial thinning surveys (4%) Reforestation surveys for release and thinning evaluation (7%) Regeneration Establishment Model (0.1%)
 Post-planting stocking surveys (9%) Pre-commercial thinning surveys (4%) Reforestation surveys for release and thinning evaluation (7%) Regeneration Establishment Model (0.1%)")
56
Data Manipulation Stand Exams – tree list 3001 1.2C 51 0 38 0 03 1 30 905303 3002 1.3WP 209 4 105 0345 497 2 2 3003 1.9WP 135 0 70 0 00 0 3004 1.2GF 78 16 55 0 03 1 3005 2.2C 25 0 20 0 03 1 3006 1.2GF 42 0 25 0 01 1 4001 1.2GF 100 11 68 0 0420 1 1 451355303 4002 1.2GF 156 0108 0 04 1 4003 1.2GF 142 0105 0 04 1 4004 1.2C 1 0 3 0 05 1 4005 1.2GF 1 0 2 0 35 1 4006 6.2GF 1 0 1 0 05 1

57
Data Manipulation: PCT, Stocking, and Regen surveys Small or understory trees –Data collected by tpa and height class –Derive average height from dbh classes –Calculate diameter from equations in FVS manual, by species

58
Data Manipulation: PCT surveys Overstory trees 1.Use ht/dbh from field notes 2.Calculate ht from dbh 3.Calculate dbh from ht 4.Use Average of measured and calculated heights and diameters

59
Data Manipulation: Regeneration Establishment Model Evaluated species composition of 4 nearby recent clearcuts, Planted average tpa, by species composition, Grew out to start year

60
Stand File Organization For each stand –A tree list file (*.fvs) –An addfile (*.kcp) Treatments to stands in-between last inventory and simulation start point (for example pct) Stand treatments throughout simulation
 –An addfile (*.kcp) Treatments to stands in-between last inventory and simulation start point (for example pct) Stand treatments throughout simulation")
62
Stand File Organization Using SUPPOSE For each scenario (cust, comm, actv) –A different location file (*.loc) that references a different stand list file (*.slf) –The location file contains only reference to the appropriate stand list file
 –A different location file (*.loc) that references a different stand list file (*.slf) –The location file contains only reference to the appropriate stand list file")
63
Stand File Organization Using SUPPOSE For each scenario (cust, comm, actv) –The location file contains reference to stand list files, site data, “groups”, and treatment files
 –The location file contains reference to stand list files, site data, groups , and treatment files")
65
Generating Comparison Attributes Used “Event Monitor” commands Placed in add.files Focused on: – quantitative attributes of stands (e.g. basal of DF of trees above 9” diameter) –or site attributes (habitat type)
 –or site attributes (habitat type).")
66
Generating Comparison Attributes “Ecological” Algorithms developed from: 1) Habitat Suitability Indices, 2) Indices of stand susceptibility to pathogens and insects, adapted a photo interp method to FVS (Hessburg et al. 1999) 3) Features of FFE model (e.g. crowning index)
 3) Features of FFE model (e.g. crowning index).")
67
Generating Comparison Attributes “Commodity” or timber algorithms developed from: 1) equations, evaluated timber by –species, –species group –size class –Periodicity
 equations, evaluated timber by –species, –species group –size class –Periodicity")
68
Concentrated vs. Diffuse

72
Data Extraction Data from.cp2 files goes easily into EXCEL Data from tree list files can be excised using TOSS program, needs additional manipulation to go into EXCEL Data from FFE model was excised manually, painstakingly

73
Problems with Model Management in patches not possible, generalizes across one acre Lodgepole pine and hardwood algorithms problematic

75
Problems with Model Linkages Outputs to spreadsheet difficult

76
Cumulative Cut by “Shade-Group”

77
Cumulative Size Distribution

78
Shade-Intolerant Cover Types

79
Crown fire risk… Varies across the landscape

80
Spruce Budworm

81
Findings Social concerns can, perhaps must be incorporated into management, may be somewhat predictable LMZs a useful organizing principle for all scenarios Outcomes can be predicted and compared on economic and other bases

82
Findings Active management (EM) –Intensive –Lower but predictable harvest volumes –Decrease crown fire risk –Decrease susceptibility to insects and diseases
 –Intensive –Lower but predictable harvest volumes –Decrease crown fire risk –Decrease susceptibility to insects and diseases")
83
Findings Custodial –Maintained high disturbance risk –Lowest habitat diversity across landscape but most old forest habitat –Least road activity

84
Findings Commodity –Highest timber volume –Predictable –Concentrated management leaves higher potential risk to disturbance in some stands –Diverse across a landscape –Increased fragmentation

85
Significance Developed LMZs using social, ecological and economic factors Developed silvicultural prescriptions Demonstrated predictable timber harvest can result from active management Adapted growth and yield models for landscape planning Compared outcomes for active, commodity, and custodial scenarios

86
FVS Rocks: Predicts Management Designed to be: Ecologically sustainable Socially acceptable Economically feasible

Similar presentations