Download presentation
Presentation is loading. Please wait.

1
FIN 685: Risk Management Topic 6: VaR Larry Schrenk, Instructor

2
Types of Risks Value-at-Risk Expected Shortfall

3
Types of Risk

4
Market Risk Credit Risk Liquidity Risk Operational Risk

5
VaR

6
J. P. Morgan Chairman, Dennis Weatherstone and the 4:14 Report 1993 Group of Thirty 1994 RiskMetrics

7
Probable Loss Measure Multiple Methods Comprehensive Measurement Interactions between Risks

8
There is an x percent chance that the firm will loss more than y over the next z time period.”

9
Correlation Historical Simulation Monte Carlo Simulation

10
Historical Prices – Various periods Values Portfolio in Next Period Generate Future Distributions of Outcomes

11
Variance-covariance – Assume distribution, use theoretical to calculate – Bad – assumes normal, stable correlation Historical simulation – Good – data available – Bad – past may not represent future – Bad – lots of data if many instruments (correlated) Monte Carlo simulation – Good – flexible (can use any distribution in theory) – Bad – depends on model calibration Finland 2010
 Monte Carlo simulation – Good – flexible (can use any distribution in theory) – Bad – depends on model calibration Finland 2010")
12
Basel Capital Accord – Banks encouraged to use internal models to measure VaR – Use to ensure capital adequacy (liquidity) – Compute daily at 99 th percentile Can use others – Minimum price shock equivalent to 10 trading days (holding period) – Historical observation period ≥1 year – Capital charge ≥ 3 x average daily VaR of last 60 business days Finland 2010
 – Compute daily at 99 th percentile Can use others – Minimum price shock equivalent to 10 trading days (holding period) – Historical observation period ≥1 year – Capital charge ≥ 3 x average daily VaR of last 60 business days Finland 2010")
13
At 99% level, will exceed 3-4 times per year Distributions have fat tails Only considers probability of loss – not magnitude Conditional Value-At-Risk – Weighted average between VaR & losses exceeding VaR – Aim to reduce probability a portfolio will incur large losses Finland 2010

14
E.G. RiskMetrics Steps 1.Means, Variances and Correlations from Historical Data Assume Normal Distribution 2.Assign Portfolio Weights 3.Portfolio Formulae 4.Plot Distribution

16
Assuming normal distribution 95% Confidence Interval – VaR -1.65 standard deviations from the mean 99% Confidence Interval – VaR -2.33 standard deviations from the mean

18
Two Asset Portfolio AssetReturnVarWeightCov A20%0.0450%0.02 B12%0.0350%

19
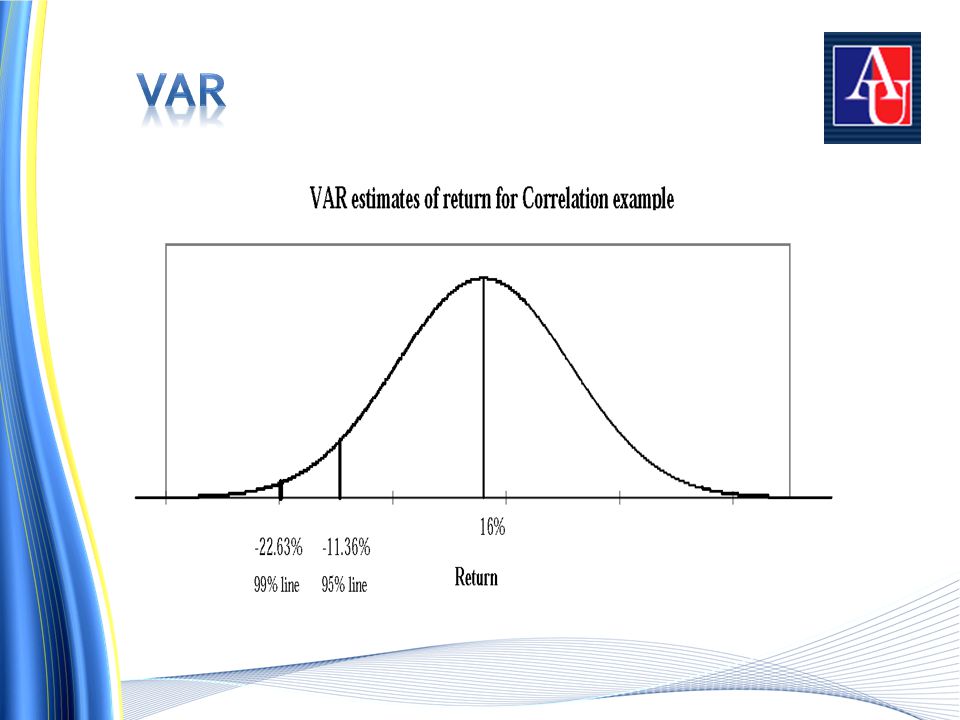
= 0.1658 5% tail is 1.65*0.1658 = 0.2736 from mean Var = 0.16 - 0.2736 =-0.1136 There is a 5% chance the firm will loss more than 11.35% in the time period

20
= 0.1658 1% tail is 2.33*0.1658 = 0.3863 from mean Var = 0.16 - 0 0.3863 =-0.2263 There is a 1% chance the firm will loss more than 22.63% in the time period

22
Steps 1.Get Market Data for Determined Period 2.Measure Daily, Historical Percentage Change in Risk Factors 3.Value Portfolio for Each Percentage Change and Subtract from Current Portfolio Value

23
Steps 6.Rank Changes 7.Choose percentile loss 95% Confidence – 5 th Worst of 100 – 50 th Worst of 1000

24
1. Model changes in risk factors – Distributions – E.g.r t+1 = r t + + r t + t 2. Simulate Behavior of Risk Factors Next Period 3. Ranks and Choose VaR as in Historical Simulation

25
One Number Sub-Additive Historical Data No Measure of Maximum Loss

26
Holding period – Risk environment – Portfolio constancy/liquidity Confidence level – How far into the tail? – VaR use – Data quantity

27
Benchmark comparison – Interested in relative comparisons across units or trading desks Potential loss measure – Horizon related to liquidity and portfolio turnover Set capital cushion levels – Confidence level critical here

28
Uninformative about extreme tails Bad portfolio decisions – Might add high expected return, but high loss with low probability securities – VaR/Expected return, calculations still not well understood – VaR is not Sub-additive

29
A sub-additive risk measure is Sum of risks is conservative (overestimate) VaR not sub-additive – Temptation to split up accounts or firms
 VaR not sub-additive – Temptation to split up accounts or firms")
Similar presentations


 1.>")


 Chance constrained programming – Min variance – Max return s.t. Prob{function≥target}≥α – Max Prob{function≥target}>")


 VAR is the maximum loss over a target>")