Download presentation
Presentation is loading. Please wait.

1
Celera Assembler Arthur L. Delcher Senior Research Scientist CBCB University of Maryland

2
Slides by Art Delcher, Mike Schatz, and Adam Phillippy Center for Bioinformatics and Computational Biology Univ. of Maryland

3
DNA target sample SHEAR & SIZE (16 of these) e.g., 10Kbp ± 8% std.dev. End Reads / Mate Pairs CLONE (16 of these) & END SEQUENCE (automated) & END SEQUENCE (automated) 550bp 10,000bp Mate-Pair Shotgun DNA Sequencing
 & END SEQUENCE (automated) & END SEQUENCE (automated) 550bp 10,000bp Mate-Pair Shotgun DNA Sequencing.")
4
SIZE SELECT e.g., 10Kbp ± 8% std.dev. SHEAR Shotgun DNA Sequencing (Technology) DNA target sample Vector LIGATE & CLONE Primer End Reads (Mates) SEQUENCE 550bp
 DNA target sample Vector LIGATE & CLONE Primer End Reads (Mates) SEQUENCE 550bp.")
5
Whole Genome Shotgun Sequencing – Early simulations showed that if repeats were considered black boxes, one could still cover 99.7% of the genome unambiguously. BAC 5’ BAC 3’ – Collect another 20X in clone coverage of 50Kbp end sequence pairs: pairs for Human. ~ 1.2million pairs for Human. – Collect 10x sequence in a 1-to-1 ratio of two types of read pairs: reads for Human. ~ 35million reads for Human. Short Long 2Kbp 10Kbp + single highly automated process + only three library constructions – assembly is much more difficult

6
Physical Mapping Clone-by-Clone Genome Sequencing Target – – 2 separate processes – clone libraries unstable, maps hard to complete – sequencing libraries must be made for every clone + assembly problem ‘easy’ and well understood Minimum Tiling Set (~33,000 BACs for human) for human) Shotgun Assembly
 for human) Shotgun Assembly")
7
Celera’s Sequencing Factory

8
300 ABI 3700 DNA Sequencers 50 Production Staff 20,000 sq. ft. of wet lab 20,000 sq. ft. of sequencing space 800 tons of A/C (160,000 cfm) $1 million / year for electrical service $10 million / month for reagents Celera’s Sequencing Factory (circa 2001)
 $1 million / year for electrical service $10 million / month for reagents Celera’s Sequencing Factory (circa 2001).")
9
Collected 27.27 Million reads = 5.11X coverage 21.04 Million are paired (77%) = 10.52 Million pairs 2Kbp5.045 M98.6% true <6% std.dev. 10Kbp4.401 M98.6% true <8% std.dev. 50Kbp1.071 M90.0% true <15% std.dev. Validated against finished Chrom. 21 sequence The clones cover the genome 38.7X times Data is from 5 individuals (roughly 3X, 4 others at.5X) Human Data (April 2000)
 Human Data (April 2000).")
10
Consensus (15- 30Kbp) Reads Contig Assembly without pairs results in contigs whose order and orientation are not known. ? Pairs, especially groups of corroborating ones, link the contigs into scaffolds where the size of gaps is well characterized. 2-pair Mean & Std.Dev. is known Scaffold Pairs Give Order & Orientation

11
ChromosomeSTS STS-mapped Scaffolds Contig Gap (mean & std. dev. Known) Read pair (mates) Consensus Reads (of several haplotypes) SNPs External “Reads” Anatomy of a WGS Assembly
 Read pair (mates) Consensus Reads (of several haplotypes) SNPs External Reads Anatomy of a WGS Assembly.")
12
WGS Sequencing WGS Assembly Performance

13
Detect repeats and so avoid being misled by them, leave for the last. Make 1st order use of mate-pairs: first to circumnavigate and later to fill in repeats. Make all the sure moves first tiered phases that get progressively more aggressive output a complete audit trail of the evidence for assembly. Assembler Design Philosophy

14
Repeat Rez I, II Assembly Pipeline (circa 2006) Overlapper Unitiger Scaffolder Trim & Screen Reads (typically 800bp) are quality-trimmed so that average error rate is.5% with 1-in-1000 having more than 2% error. Average trim length is 500-900bp, depending on the genome. (590bp for human in year 2000) Contaminant and vector sequence is removed Repeat screening makes run time and overlap graph size reasonable, e.g. 10 6 overlaps per Alu read must be avoided. Now we dynamically Now we dynamically limit repetitive overlaps in the overlap phase. gatekeeper program to vet inputs/assign ID’s Reads stored in compressed, random-access binary store.
 Contaminant and vector sequence is removed Repeat screening makes run time and overlap graph size reasonable, e.g overlaps per Alu read must be avoided. Now we dynamically Now we dynamically limit repetitive overlaps in the overlap phase. gatekeeper program to vet inputs/assign ID’s Reads stored in compressed, random-access binary store..")
20
Repeat Rez I, II Assembly PipelineOverlapper Unitiger ScaffolderAB impliesA B TRUE ORAB REPEAT- INDUCED Find all overlaps 40bp allowing 6% mismatch. Trim & Screen

21
Repeat Rez I, II Assembly Pipeline Compute all “overlap consistent” sub-assemblies: Compute all “overlap consistent” sub-assemblies: Unitigs (Uniquely Assembled Contig) Overlapper Unitiger Scaffolder Trim & Screen
 Overlapper Unitiger Scaffolder Trim & Screen")
22
OVERLAP GRAPH Edge Types:AB A BA B BB BAA A Regular Dovetail Prefix Dovetail Suffix Dovetail E.G.: Edges are annotated with deltas of overlaps

23
The Unitig Reduction 1. Remove “Transitively Inferrable” Overlaps: AB C AB C

24
The Unitig Reduction 2. Collapse “Unique Connector” Overlaps: A B AB 412 352 45

25
Unitigs: Definition Chordal Subgraph with no conflicting edges. Conflicting edge quely Assemble-able Con Uniquely Assemble-able Contig

26
Unitig Theorem (Myers, JCB ‘95) (1) Remove contained fragments (2) Remove transitively inferred edges (3) Collapse into unitigs (*) Restore t.i. edges between unitig ends. THM: Shortest Common Superstring of unitigs = Shortest Common Superstring of reads Caveat: SCS is not the right objective for assembly.

27
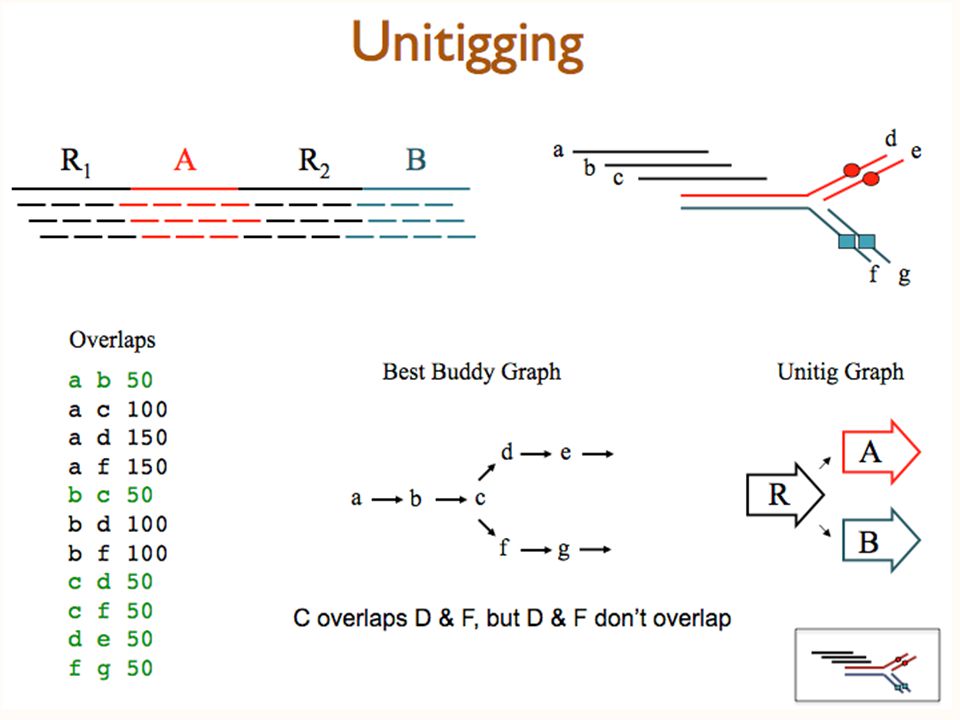
Revised Unitigger Algorithm Preceding algorithm is computationally expensive Current unitigger finds the “best” overlap on each end of each read—its “best buddy”. Unitigs are chains of mutually unique best buddies— adjacent reads are best buddies of each other and of no other read. This takes time and space linear in the number of reads. In rare cases results are different from graph reduction.

30
Branch Point Extension A repeat boundary reflected on an underlying sequence read. D C B Genome A Peers of A C Compare peers to detect branch pts. Consider graph without repeat-full edges and recompute unitigs D B Makes sure you get a read-length into each repeat induced gap (most Alu sized elements are resolved) A
 A.")
31
Bubble Smoothing412 352 245 486

32
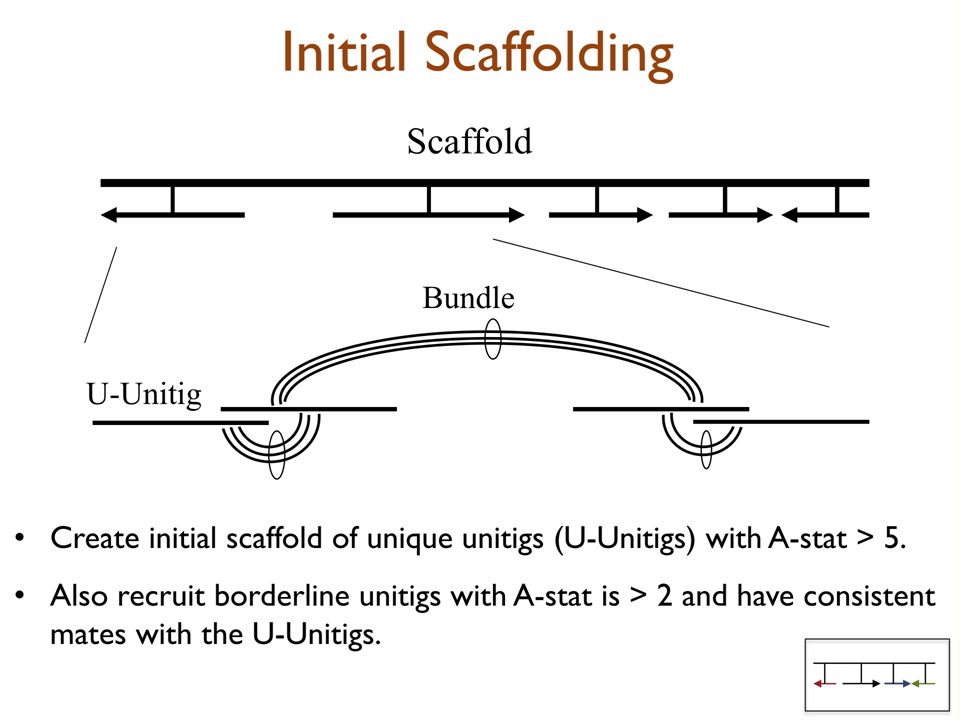
Assembly Pipeline Identify those that cover unique DNA = Identify those that cover unique DNA = U-unitigs-10 +10 0 Definitely Unique Definitely Repetitive Don’t Know Dist. For Unique Dist. For Repetitive Repeat Rez I, II Overlapper Unitiger Scaffolder Unique Repetitive Trim & Screen

33
Arrival Intervals is log-odds ratio of probability unitig is unique DNA versus 2-copy DNA. Arrival rate statistic (A-stat) is log-odds ratio of probability unitig is unique DNA versus 2-copy DNA. Definitely Unique Definitely Repetitive Don’t Know -10 +10 0 Dist. For Unique Dist. For Repetitive Unique DNA unitig Repetitive DNA unitig Identifying Unique DNA Stretches
 is log-odds ratio of probability unitig is unique DNA versus 2-copy DNA. Definitely Unique Definitely Repetitive Don’t Know Dist. For Unique Dist. For Repetitive Unique DNA unitig Repetitive DNA unitig Identifying Unique DNA Stretches.")
36
Repeat Rez I, II Assembly PipelineOverlapper Unitiger Scaffolder Fill repeat gaps with doubly anchored positive unitigs Fill repeat gaps with doubly anchored positive unitigs Unitig>0 Trim & Screen

37
Repeat Rez I, II Assembly PipelineOverlapper Unitiger Scaffolder Fill repeat gaps with assembled, singly anchored reads Fill repeat gaps with assembled, singly anchored readsStones Trim & Screen

38
Surrogates Stones containing more than 1 read are added to contigs as consensus sequence only, without underlying reads. Called “surrogates” Allows repeat unitigs to be put in multiple positions in the assembly, but leaves regions without underlying read coverage. We later attempt to resolve surrogates, by assigning reads from the original repeat unitig to the separate surrogate copies, based on mate pairs.

Similar presentations


 3. cycle sequencing 4. large scale sequencing stefanie.hartmann.>")


 2.Sequence some “seed” clones.>")
, –if you have the capability, mail complete questions, figures, etc. and.>")


>")

