Download presentation
Presentation is loading. Please wait.

1
Investing in Global Agriculture Robert L. Thompson Professor Emeritus, University of Illinois and Visiting Scholar, Johns Hopkins University School of Advanced International Studies May 8, 2012

2
The Dual Challenges To feed the world’s larger population, most of which will be in low income countries, better than today at reasonable cost without damaging the environment. –Agriculture in most low income countries is underperforming relative to its potential, thereby contributing less to national and global food supply. To reduce extreme poverty in rural areas of low income countries, where the majority of it resides.

3
Hunger & Food Insecurity Widespread 1.4 billion people live on less that $1.25/day. –1 billion people (1 out of every 7 people in the world) cannot afford 1,800 calories per day. 2.6 billion (40%of the world population) live on <$2.00 per day. –By $2.00 per day most hunger (calorie) problems solved, but 1 billion still suffer nutritional deficiencies.
 cannot afford 1,800 calories per day. 2.6 billion (40%of the world population) live on <$2.00 per day. –By $2.00 per day most hunger (calorie) problems solved, but 1 billion still suffer nutritional deficiencies..")
4
Malnutrition Has a High Cost Malnutrition from -9 to +24 months (“the first thousand days”) can cause permanent stunting of a child’s mental and physical development. Malnutrition of school-age children can reduce their capacity to learn in school. Malnutrition can reduce adults’ labor productivity and earning potential.

5
The Hunger-Poverty Nexus Most hunger is associated with poverty. –The rich in no country go hungry except in times of war, natural disaster or politically- imposed famine. To solve the world’s hunger problem, the world poverty problem must be solved. 70% of the extreme poor live in rural areas. –Most are farmers, and most are net food buyers.

6
Number of People Living in Extreme Poverty (in millions, 2005) Region<$1.25/day<$2.00/day South Asia 596 1,092 Sub-Saharan Africa 388 556 East Asia & Pacific 316 729 Latin America & Carib 45 94 E. Europe & Central Asia 17 42 Middle East & N. Africa 11 51 Total 1,374 2,564 Source: World Bank. World Development Indicators 2011.

7
Purchasing Power Income adjusted for the cost of living, the largest component of which in low income countries is the cost of food. –The poorer a household is, the larger the percent of its income spent on food. Increases in the price of food reduce the purchasing power of low income people’s income. –The lower one’s income, the larger the percentage reduction in purchasing power caused by any given increase in cost of food.

8
Share of Food* Expenditures in Total Expenditures (Percent) QuintileBangladeshIndiaIndonesiaPhilippines 1st69.362.063.364.6 2nd66.959.458.159.2 3rd63.256.254.1 4th58.750.849.047.7 5th45.236.437.935.4 *”Food” in low income countries has much less value-added after the farm gate than in high income countries. Source: Asian Development Bank.

10
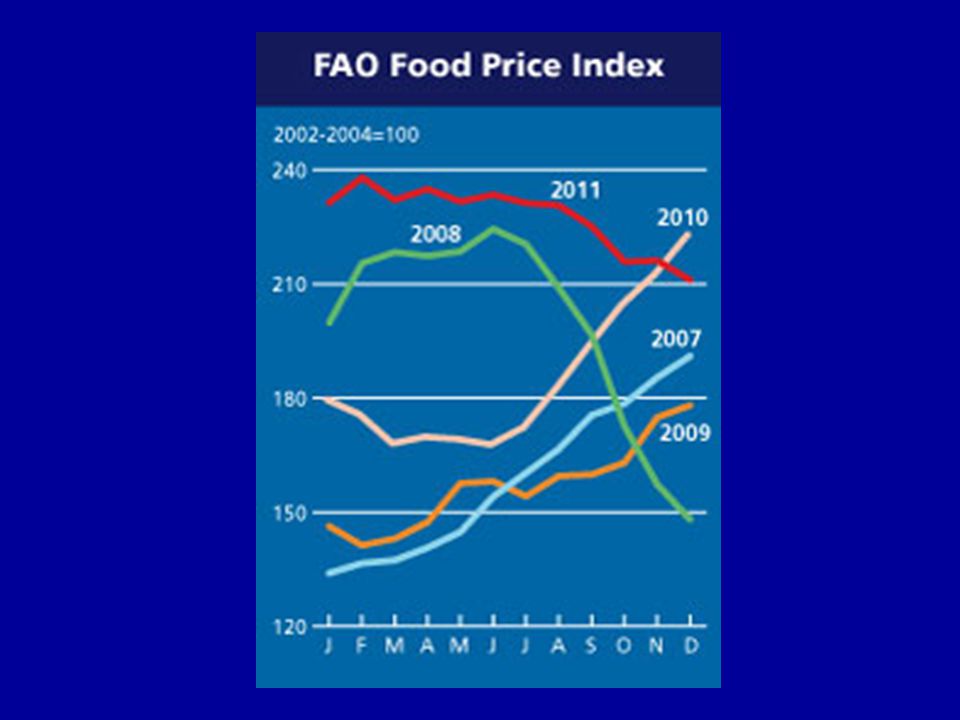
Higher Food Prices Increase the Incidence of Hunger Low income people spend a large fraction of their incomes on food, so higher food prices reduce the purchasing power of their meager incomes. The 2007-2008 price spike increased number of people suffering hunger from 925 million to over 1 billion and precipitated political crises in many countries. The need for emergency food aid exploded, but higher grain prices meant that the amount that could be procured by food aid agencies, which operate on fixed annual budgets, dropped.

11
Projected Population Growth Region2011 2050ChangePercent World 6,987 9,587 +2,600 + 38 High Income 1,242 1,333 + 91 + 7 Low Income 5,745 8,254 +2,509 + 44 East & S.E. Asia 2,183 2,308 + 125 + 6 South Central Asia 1,795 2,574 + 779 + 43 Sub-Saharan Africa 883 2,069 +1,186 +134 Lat. America/Carib 596 746 + 150 + 25 N. Africa & W. Asia 451 725 + 274 + 61 Source: Population Reference Bureau. 2011 World Population Data Sheet.

12
Dynamics of Food Demand Growth As purchasing power rises from $1 to $2 per capita per day, most hunger (calorie) problems can be solved, but sufficient protein, vitamins and minerals. As their incomes rise from about $2 to $10 per day, people eat more meat, dairy products, eggs, edible oils, fruits & vegetables, causing rapid growth in raw ag commodity demand. After about $10 per day, people buy more processing, services, packaging, variety, and luxury forms, but not more raw ag commodities.

13
Huge Growth in Food Consumption Expected from Economic Growth CountryPopulation%<$1/day%<$2/day China 1,378 9.9 34.9 India 1,155 34.3 80.4 Indonesia 230 7.5 52.4 Brazil 194 7.5 21.2 Pakistan 166 17.0 73.6 Bangladesh 170 41.3 84.0 Nigeria 155 70.8 92.4 Philippines 92 14.8 43.0 Source: World Bank. World Development Indicators 2011. Population in millions (2009).
..")
15
Projected World Food Demand World food demand to grow 70-80% by 2050 –40% increase from world population growth – from 7.0 to 9.6 billion – almost all in developing countries –30-40% increase from broad-based economic growth in low income countries The World Bank has estimated the number of people in developing countries in households with incomes >$16,000/year will rise from 352 million in 2000 to 2.1 billion by 2030. How many presently low income consumers escape from poverty is the most important uncertainty re future global demand for food. Policies that accelerate broad-based economic growth in LDCs reduce hunger, but unleash rapid growth in demand for agric. products.

16
Strategic Importance of Food From an individual country’s perspective, something is strategic if it is essential for the country to sustain its economic, political or military power. Every country has to ensure that it has a reliable, safe and nutritious, reasonably priced supply of food from a combination of domestic production and imports. It is neither economically efficient nor environmentally sustainable for countries to be self sufficient in all foods.

17
LDC Agriculture Underperforming The agricultural sector in most low income countries is underperforming relative to its potential that would be consistent with both economic efficiency and environmental sustainability. The ag sector produces less food and cash income for farm households and contributes less output to their national food supply.

18
Agriculture Underperformance Limits LDC Economic Growth Failure to develop agriculture in low income countries retards national economic growth. –Economic growth multiplier from agricultural development is larger than from manu- facturing or service sector development. Broad based economic growth accelerates growth in demand for food, often faster than local ag production can grow, and they become larger ag importers.

19
Larger Fraction of Ag Production to Move Through Trade With population growth, urbanization and broad-based economic development, many low-income countries’ food consumption will outstrip their production capacity, and they will become larger net importers. Distribution of Arable Land Distribution of World Population

20
The Land Constraint There is at most 12% more arable land available worldwide that isn’t presently forested or subject to erosion or desertification, and… Loss and degradation of many soils continues: –Urbanization & infrastructure construction –Nutrient mining –Erosion –Desertification –Natural reserves –Reforestation

21
The Land Constraint (cont’d.) The area of land in farm production could be doubled… –But only by massive destruction of forests and loss of wildlife habitat, biodiversity and carbon sequestration capacity The only environmentally sustainable alternative is to double productivity on the fertile, non- erodible soils already in crop production. Most available cropland is in remote areas of South America and Sub-Saharan Africa where infrastructure is minimal and soils are inferior in quality to many already in production.

22
Croplands of the Earth Interpretation: The darker the shading, the larger the percent of the land under that pixel that is in crops. Source: Center for Sustainability and the Global Environment (SAGE), University of Wisconsin.
, University of Wisconsin..")
23
Inherent Land Quality

24
Climate Constraints Source: International Institute for Applied Systems Analysis

25
Agriculturally Important Effects of Climate Change Warming greater over land than over water and greatest at higher latitudes. Increases variability of precipitation –Largest reduction in subtropics –Largest increases in higher latitudes –Increase under monsoons Increased frequency of extreme events, such as droughts and flooding.

26
Adaptations Will be Required Due to Global Climate Change As all agro-ecosystems shift with climate change, need larger public and private investments in adaptive plant and animal breeding just to sustain present productivity levels. – e.g. introduce more drought or heat tolerance. Change the mix of what crops are produced in a some geographic locations. Rely more on international trade.

27
Water--A Growing Constraint Farmers account for 70% of the world’s fresh water use. With the rapid urbanization underway, cities will outbid agriculture for available fresh water. The world’s farmers, who are being called on to double food production, will have to do it using less fresh water than they are using today. –i.e., they will have to more than double the “crop per drop,” the average productivity of the water they use. This will require investments in research to develop water saving technologies and to increase the drought tolerance and water use efficiency of the crop varieties being grown.

28
Need to Almost Double the Global Food System Productivity by 2050 Make presently unusable soils productive Increase genetic potential (of individual crops and/or farming system) (ditto for farm animals) Achieve as much of that potential as possible by: –Improving nutrition of that crop –Increasing water availability and control –Reducing competition from weeds for water, nutrients and sunlight –Reducing losses from disease and insects Reduce post-harvest losses
 (ditto for farm animals) Achieve as much of that potential as possible by: –Improving nutrition of that crop –Increasing water availability and control –Reducing competition from weeds for water, nutrients and sunlight –Reducing losses from disease and insects Reduce post-harvest losses")
29
Grain Yields Around the World Interpretation: Grain yields (in metric tons per hectare) rise from lowest (dark blue) to highest (dark red) Source: Center for Sustainability and the Global Environment (SAGE), University of Wisconsin.
 rise from lowest (dark blue) to highest (dark red) Source: Center for Sustainability and the Global Environment (SAGE), University of Wisconsin.")
30
That Are Many Essential Roles of Government in Development Provide legal environment and public policies that create a positive investment climate, such as –Macroeconomic and political stability –Rule of law –Definition and timely enforcement of contract sanctity –Definition of property rights, including ease of registration, transfer and enforcement thereof

31
Essential Roles of Government in Development (contd.) Invest in people (human capital) –Universal primary school education –Quality health care Build (or induce others to build) infrastructure –Roads and other transportation High cost transportation is a severe impediment –Telecommunications Markets do not work well without information –Electricity supply
 Invest in people (human capital) –Universal primary school education –Quality health care Build (or induce others to build) infrastructure –Roads and other transportation High cost transportation is a severe impediment –Telecommunications Markets do not work well without information –Electricity supply")
32
Other Important Roles of Government Invest in agricultural research –E.g. Productivity-enhancing agricultural research to lower cost of food to consumers Enforce anti-monopoly laws Correct negative externalities –E.g. pollution; odors Consumer protection –E.g. food safety; honest weights & measures Collection and dissemination of statistics

33
Decline in Investments in Agriculture Development Between 1980 to 2005, foreign aid to LDCs for ag development dropped from $8 billion to $3.4 bill./yr (from 17 to 3% of the whole) In the 1980s, 25% of US foreign aid went to agriculture; dropped to 6% by 1990 and 1% last year. Share of World Bank lending going to agriculture fell from 30% in 1978 to 16% in 1988 to 8% in 2006.

34
Long-Run Prospects Since Malthus, prophets of doom have argued population growth will increase food demand faster than agricultural production can grow. Public and private sector investments in agricultural research have increased productivity faster than demand growth, with resulting 150- year downward trend in real price of grains. Need big increase in world food production by 2050 using less water and little more land than today and also produce biofuels feedstocks. Future world market price trends will depend on whether land and water productivity rise faster or slower than world demand grows.

35
Growing Agricultural Trade The world’s arable land is not distributed around in the world in the same proportions as is population. (No way for Asia or North Africa & Middle East to be self-sufficient.) Agriculture in most LDCs underperforming rela- tive to its potential, but disincentives declining. With population growth & broad-based economic development in LDCs, growth in their food demand will outstrip production potential & more of world ag production will move through trade. Greater trading opportunities for LDCs would accelerate their economic growth and accelerate growth in their food consumption and imports. Need a successful WTO Doha Round.
 Agriculture in most LDCs underperforming rela- tive to its potential, but disincentives declining. With population growth & broad-based economic development in LDCs, growth in their food demand will outstrip production potential & more of world ag production will move through trade. Greater trading opportunities for LDCs would accelerate their economic growth and accelerate growth in their food consumption and imports. Need a successful WTO Doha Round..")
Similar presentations


>")
