Download presentation
Presentation is loading. Please wait.

1
Tips and Tricks for Building Rich Reports in SQL Server 2012 Reporting Services Bob Meyers Senior Program Manager Microsoft Corporation DBI307

4
http://explore.data.gov/Agriculture/U-S-Lettuce-Statistics/w87x-qfjw United States Department of Agriculture

6
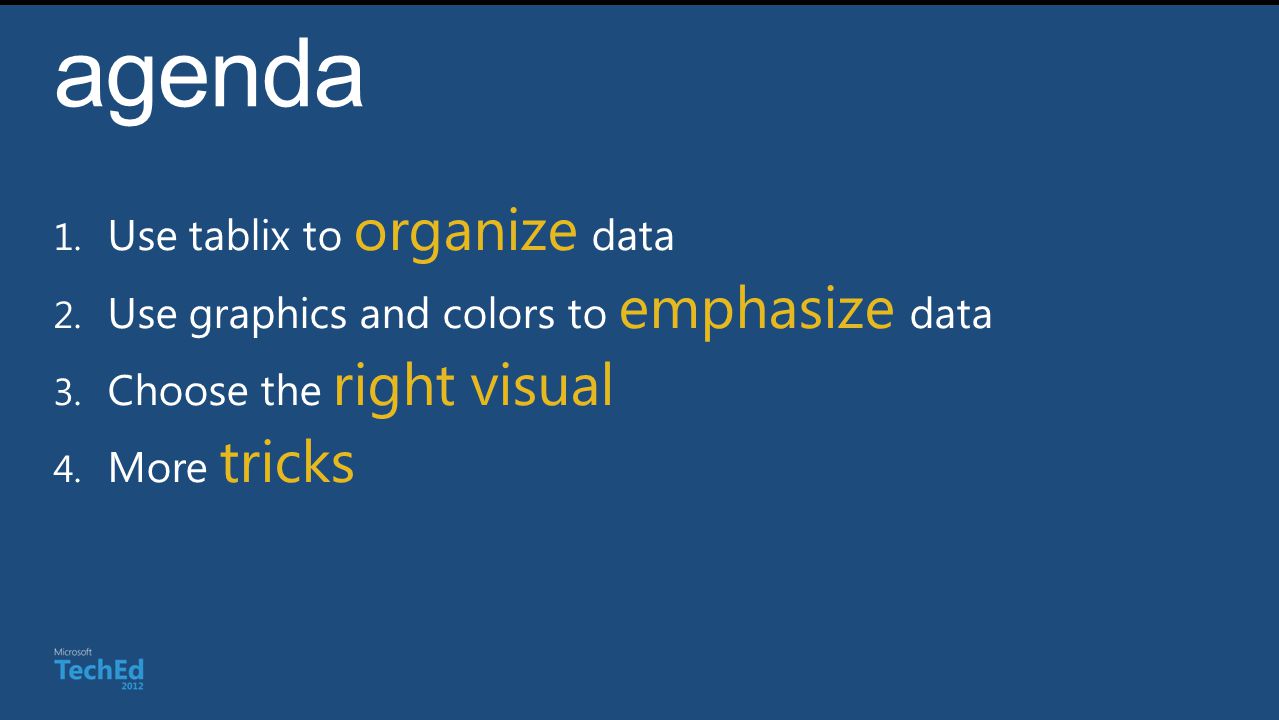
Microsoft tablix = table rows columns row row group

7
Microsoft tablix = table

8
building a table demo

9
Microsoft tablix = table

10
Microsoft tablix = table + matrix row group row column column group

11
Microsoft tablix = table + matrix ++ column column group column

12
demo building a matrix

14
Microsoft emphasize data

15
Microsoft emphasize data thin font space, not lines dim labels 1 accent color no fluff

16
Microsoft emphasize data visualize rules simple icons

17
Microsoft emphasize data http://blogs.msdn.com/b/bobmeyers/archive/2009/07/31/add-excel-like-color-scale-conditional-formatting-to-your-reports.aspx color scales small area =Code.ColorScaleRYG(dataValue, 0.8, 1.0)
")
18
Microsoft emphasize data

19
Microsoft emphasize data

20
Microsoft emphasize data color scales small area lighter fills darker lines/text 98.7%

21
Microsoft emphasize data time = sparkline simple colors expandable align axes?

22
Microsoft emphasize data data bars use color align axis

23
Microsoft emphasize data sparkpies? simple colors 12:00

24
Microsoft emphasize data cards use a picture butterfly align space between 1 accent hue

25
Microsoft emphasize data cards use a picture butterfly align 1 accent hue

26
demo emphasize data

28
Microsoft the right visual make your tables pop

29
Microsoft the right visual use bars for categories

30
Microsoft the right visual use lines for sequence

31
Microsoft the right visual consider sparklines instead of series

32
Microsoft the right visual use a scatter chart for correlation

35
Microsoft clipboard data ?

36
Microsoft clipboard data …

37
Microsoft clipboard data

38
Microsoft related data =Lookup(thisfield, otherField, returnField, datasetName) dataset 2dataset 1
 dataset 2dataset 1")
39
Microsoft short lists =Code.JoinSorted(...) =Join(LookupSet(thisfield, otherField, returnField, datasetName), delimiter) =Code.JoinDistinctSorted(...) *NOTE: matches one field only – no group context or filters
 =Join(LookupSet(thisfield, otherField, returnField, datasetName), delimiter) =Code.JoinDistinctSorted(...) *NOTE: matches one field only – no group context or filters")
40
Microsoft output to Excel

41
Microsoft output to Excel

43
Microsoft output to Excel

48
Breakout Sessions Mon 4:45DBI206 Business Intelligence and Data Visualization Tue 10:15DBI202 The 12 Reasons to Love Microsoft SQL Server 2012 Wed 3:15DBI201 What’s New in Microsoft SQL Server Reporting Services Hands-on Labs DBI52-HOL Exploring Power View in SQL Server 2012 Product Demo Stations Breakthrough Insights: Managed Self-Service BI Breakthrough Insights: Rapid Data Exploration and Visualization Find Me Later At… Database and Business Intelligence area in the TLC

49
@sqlserver @ms_teched mva Microsoft Virtual Academy SQL Server 2012 Eval Copy Get Certified! Hands-On Labs

50
Connect. Share. Discuss. http://northamerica.msteched.com Learning Microsoft Certification & Training Resources www.microsoft.com/learning TechNet Resources for IT Professionals http://microsoft.com/technet Resources for Developers http://microsoft.com/msdn

51
Required Slide Complete an evaluation on CommNet and enter to win!

52
Scan the Tag to evaluate this session now on myTechEd Mobile

Similar presentations


 Laura Chappell Founder, Wireshark University Founder,>")


 Brent Ozar PLF, LLC DBI328.>")


