Download presentation
Presentation is loading. Please wait.

1
Bell Ringer Which line is the predator? Which line is the prey? What happens to the predator population when the prey population decreases? What causes the prey population to decrease?

2
T-Chart Main Idea My Details Predator-Prey Relationship
-If prey population decreases then predator population decreases

3
Humans in the Biosphere
Chapter 6 Humans in the Biosphere

4
The Effect of Human Activity
Humans affect global environments through: Agriculture Development Industry Resources that are affected: Soil Water Atmosphere

5
Agriculture One of the most important inventions in human history
Encouraged the growth of modern civilizations Monoculture- planting the same crop in the same spot year after year. Negatives: Use of water, soil, and fossil fuels

6
Development Americans live in dense populated urban areas
Too crowded Developed Suburbs More People = More Waste Negatives: Consumes farmlands, destroys natural habitats Waste affects air, water, and soil

7
Industrial Growth Inspired by the Industrial Revolution of the 1800s
Needed to provide the United States with up to date technology Negatives: Requires A LOT of energy Industries have traditionally discarded wastes directly into the air, water, soil

8
Sustainable Development
Sustainable Development- provides for human needs while preserving the ecosystems that produce natural resources Should do more than just enable people to survive, it should help them improve their situation. Examples: Solar Power, Wind Energy, Etc.

9
Renewable and Nonrenewable Resources
Renewable Resources- can be produced or replaced by a healthy ecosystem Example: white pine tree, can grow back after being cut down Nonrenewable Resources- Natural processes can not replenish them in a reasonable amount of time. Example: Fossil fuels take millions of years to renew

10
Class Assignment Silently, list how humans are affecting the south shore or greater Chicago area environment. Give an example of each.

11
Closure Write the conclusion section for our class MEL-Con. Generate 2 ideas for sustainable development and how it might help solve the problems that we listed earlier.

12
Bell Ringer What three human activities have transformed the biosphere? USE YOUR NOTES ----- Meeting Notes (11/8/11 12:50) -----
")
13
6.1 Review 3 human affectivities that affect biosphere:
Agriculture- Farming Development-Urbanization, creating suburbs Industrial Growth-Factories, mass production Resources that are affected: Soil Water Atmosphere

14
6.2 Using Resources Wisely
Key Questions: Why is soil important, and how do we protect it? What are the primary sources of water pollution? What are the major forms of air pollution?

15
Soil Resources Soil Erosion-removal of soil by water or wind
Dust Bowl Desertification- Process of farmland turning into desert Causes: Farming, overgrazing, drought, and climate change

16
Soil Resources Deforestation-Loss of forests
Leads to severe soil erosion Trees help keep the soil in place, absorb carbon dioxide, and protects fresh water supplies Over half the worlds old-growth forest have been lost to deforestation

17
Soil Resources How can we protect our soil?

18
Freshwater Resources Humans depend on fresh water for: Drinking water
Industry Transportation Energy Waste disposal

19
Water Pollution Pollutant-a harmful material that can enter the biosphere Point source pollution-enters from single source Example: Oil spill or factory Nonpoint source pollution: enters from many sources Example: Run-off from the road or chemicals released into the air by cars and factories

20
Main Sources of Pollution
Industrial and agriculture chemicals Residential sewage Nonpoint sources

21
Biological Magnification
Occurs when a pollutant, such as DDT, is picked up by an organism and is not broken down or eliminated from its body. Travels through the energy pyramid

22
Water Pollution What are the primary sources of water pollution?
How can we stop water pollution?

23
Class Assignment By yourself, work on the chapter 6.2 handout

24
Class Activity Individually, list a couple human activities that affect the south shore community environment.

25
Class Activity As a group, discuss the factors that you just listed. Group every factor into categories.

26
Bell Ringer List two ways to prevent soil erosion.
List 2 ways to reduce water pollution. USE YOUR NOTES

27
6.2 Continued What are the major forms of air pollution?

28
Atmospheric Resources
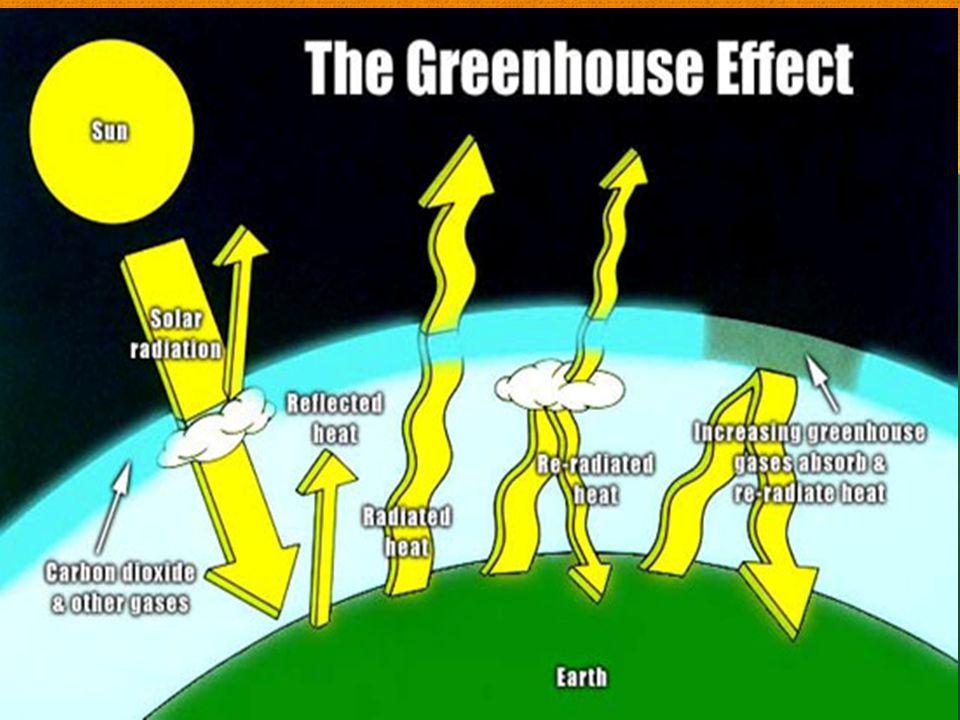
Atmosphere Absorbs harmful ultraviolet radiation Provides oxygen Regulates global temperature (without greenhouse effect, earth would be 30 degrees Celsius cooler)
")
29
Air Pollution Common forms of air pollution are: Smog Acid rain
Greenhouse gases

30
Air Pollution Smog- Gray-brown haze formed by chemical reactions among pollutants released into the air

31
Acid Rain Acid Rain Caused by releasing nitrogen and sulfur into air
Combine to form nitric and sulfuric acid Can kill plants Can change composition of soil

33
Greenhouse Gases Come from:
Cars Cows Industry Homes Agriculture Definition- Carbon gases that are released into the atmosphere that contribute to global warming and climate change

35
Class Assignment Pg. 182 #1-7

36
Bell Ringer Get your notes out and study for the 6.1 and 6.2 vocabulary quiz. (5 minutes)
")
37
Corners Activities After hearing the statement read by your teacher, please walk respectfully to the corner that you agree with most: Strongly Agree, Agree, Disagree, Strongly Disagree

38
Statement #1 The laws against trading ivory should be lifted. This will improve the global economy and get the United States out of this recession.

39
Statement #2 Crops are needed in order for humans to survive. Even though growing crops can cause soil erosion and hurt natural habitats, humans should continue to grow crops because they are needed to help humans survive.

40
Statement #3 Humans are the main reason why some natural habitats are no longer able to support the plant and animal populations that were once in that natural habitat.

41
Biodiversity Biodiversity- total of all the genetically based variation in all organisms in the biosphere.

42
Types of Biodiversity Ecosystem diversity- variety of habitats, communities, and ecological processes Species diversity- number of different species in the biosphere, or in a particular area. Genetic Diversity- sum total of all different forms of genetic information carried by a particular species

43
Threats to Biodiversity
Five threats: Altered Habitats- habitats eliminated for urban or agriculture reasons Habitat Fragmentation-development causes habitats to split Hunting and the Demand for Wildlife Products- Causes extinction Introduced Species- Example- Asian Carp Pollution Example- DDT (Biological Magnification) Climate Change
 Climate Change.")
44
Conserving Biodiversity
Ecological hot spot- place where significant numbers of species and habitats are in immediate danger of extinction.

45
Class Assignment Complete the 6.3 worksheet
Use your textbook and notes

46
Bell Ringer What are the five major threats to biodiversity? (Use your notes) Who is responsible for these threats on biodiversity?
 Who is responsible for these threats on biodiversity.")
47
Homework Review Take out your chapter 6.3 worksheet for review

48
Causes Deforestation Air Pollution Water Pollution Development
Industrial Growth

49
Bell Ringer Explain why a paper company would say that deforestation is not as bad as people make it out to be. At least 3 sentences Use “Lorax” notes/worksheet

50
Chapter 6.4 Key Questions How does the average ecological footprint in America compare to world’s average? How can ecology guide us toward a sustainable future?

51
Ecological Footprints
Ecological Footprint-total amount of functioning ecosystem needed to both provide the resources a human population uses, and to absorb the wastes that population generates

53
Calculating Eco-Footprint
There is no universal method of measuring ecological footprints Makes calculating footprints very difficult

54
Calculating Ecological Footprints
Footprint Calculator

56
Comparing Footprints According to the diagram, the average American has an ecological footprint over four times larger than the global average. Twice the size of England More than twice the size of Japan Six times the size of China

57
Key Questions How does the average ecological footprint in America compare to world’s average? How can ecology guide us toward a sustainable future?

Similar presentations