Download presentation
Presentation is loading. Please wait.

1
Irrigation Assisted Rain-fed Agriculture A Sustainable Adaptation Strategy Richard McNider John Christy University of Alabama in Huntsville Dennis Bragg Bragg Farms James Hairston Donn Rodekohr Auburn University SECC/WMO Orlando, FL

2
mcnider@nsstc.uah.edu

3
In the coming century the United States will be faced with three critical agricultural issues Food Security Can the US maintain its agricultural output in the face of potential declines in production due to water pressures in the West and High Plains? Energy Security Can the US expand its agricultural output to meet biofuel needs and not impact food supplies? World Food With the world as a whole still facing a calorie deficit can the U.S. provide leadership to increase food production in a sustainable fashion?

4
Rain-fed Agriculture in the Eastern U.S. At the turn of the 20 th century most of the U.S food and fiber production was found in the East and Midwest based on rain-fed agriculture Precipitation>Evaporation 100W Rain-fed Agriculture

5
This 1900 Eastern agricultural system was broad based Drought was a natural part of this system and drought losses were reflected in prices. Corn was grown in most every State. Potatoes CottonVegetables

6
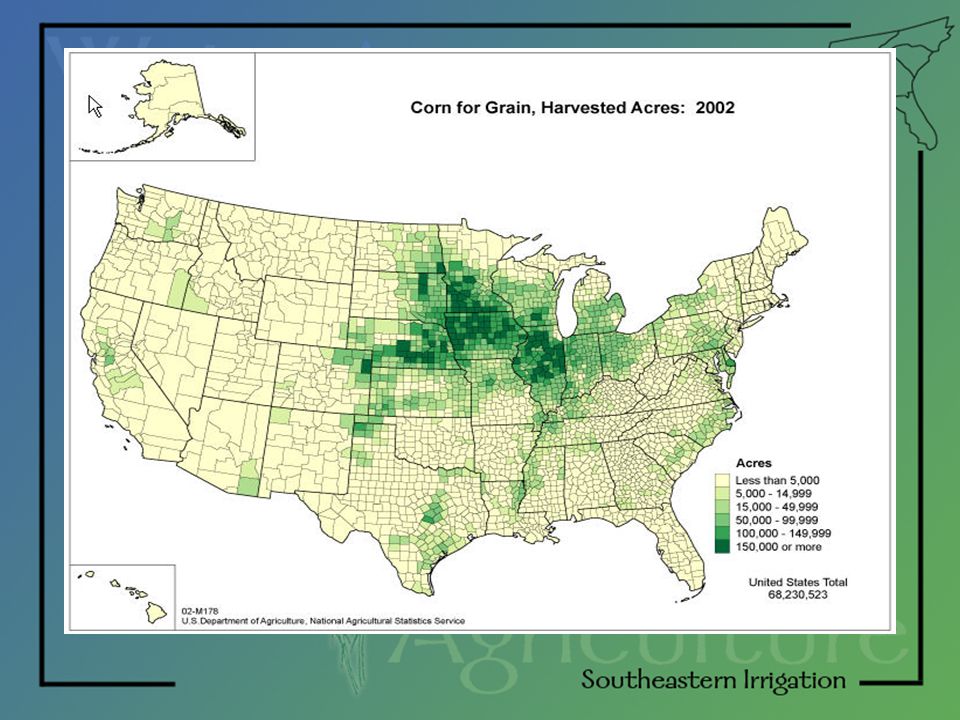
By 1980 with transportation improvements corn became concentrated in the deep water holding soils of a few states in the mid-west which insulated farmers from drought losses. Irrigation in the West removed drought losses. Potatoes Cotton Vegetables Corn

8
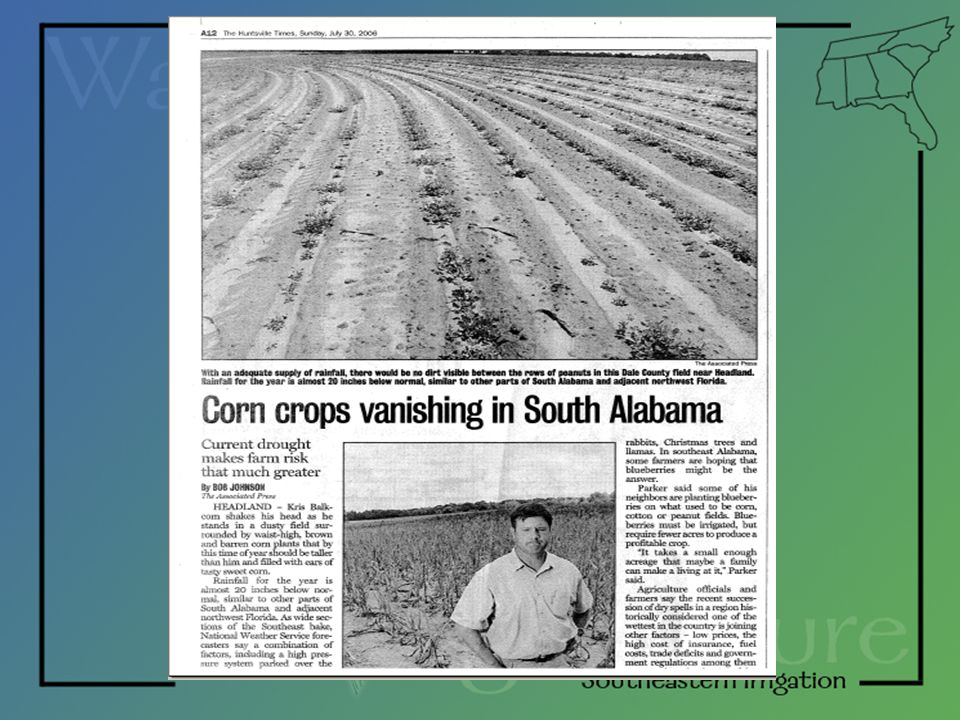
ALABAMA

9
Average Mid-west Yields Crop Model 180 Bushels per Acre In the SE with our shallow soils we are almost always in a drought. Energy, fertilizer and time wasted

11
The next 50 years may be much different than the last 50 years. New pressures are now forcing a cost-accounting for Western irrigated-agriculture. In the long-term many observers feel this desert agriculture is not sustainable. Ground water overdrafts from pumping in Ogallalah Water demand from rapid urban growth Salt and selenium surface poisoning River restoration and endangered species initiatives

12
Demand for water may not be the biggest issue facing the west. Rather, it may be supply. Recent reconstruction of climate indicate that the past 70 years may have been abnormally wet and future supply could be much less. The recent drought may be the norm. From Piechota et a. 2004 Abnormally Wet

13
Climate Change? IPCC Regional precipitation changes are uncertain. Dry areas likely to become drier and wet areas wetter.

14
What is the solution to declining production in west and need for more land in production for bio-fuels? Put land in the East back into production! Sustainable Southeastern Model - Storage of Winter Surface Water Even in dry years crops need less than a foot of water.

15
Run-off

16
Alabama River 10 to 34 million ac-ft/yr One million acre-ft withdrawn Even Year Withdrawal Irrigation can be practiced in the Southeast with undetectable fractions of rivers withdrawn while in the West whole rivers are consumed

17
Pure rain-fed agriculture in most areas is inefficient. Energy, fertilizers and time are wasted if rains don’t come at the right time. Irrigation solves these problems but it must be sustainable World should encourage irrigation where water is plentiful!

18
Tools Developed to Determine the Economic Feasibility and Environmental Sustainability of Irrigation in the SE. We have embraced crop models (DSSAT) and long- term climate data to examine economic and environmental issues in the context of climatology.
 and long- term climate data to examine economic and environmental issues in the context of climatology..")
19
Water Run-offIrrigated Acreage Why haven’t more farmers in the East not irrigated? Is it not economically viable?

20
Mid-west Irrigated Rainfed Bushels per Acre 250

21
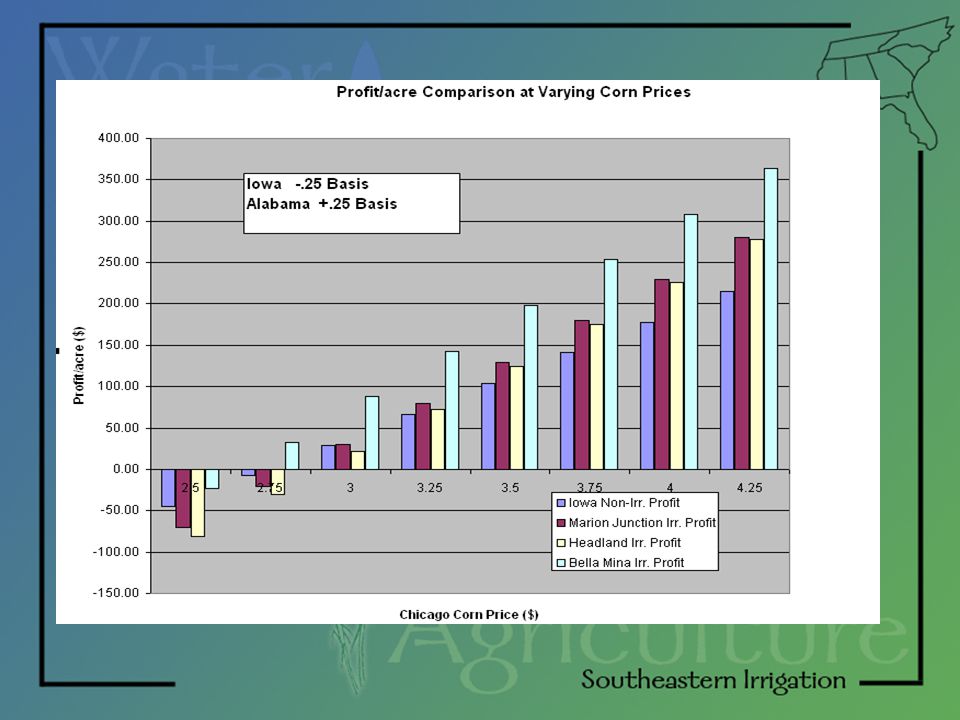
Irrigated profit Rain-fed profit

22
State investment would ensure that a choice for irrigation would be a “no-brainer” decision

24
How large should on-farm reservoirs be? Made detailed calculations of daily evaporative losses E=C(e o - e a )(1+a*u) Used dew points and wind speed from first order National Weather Service stations Used DSSAT to determine irrigation amounts
(1+a*u) Used dew points and wind speed from first order National Weather Service stations Used DSSAT to determine irrigation amounts.")
26
Jan 1 Jul 31 1.8 acre ft of water needed in reservoir per acre

27
Figure 1. Example of Drought Monitor

28
Example of the Lawn and Garden Index (LGI) for July 25, 2008.
 for July 25, 2008.")
29
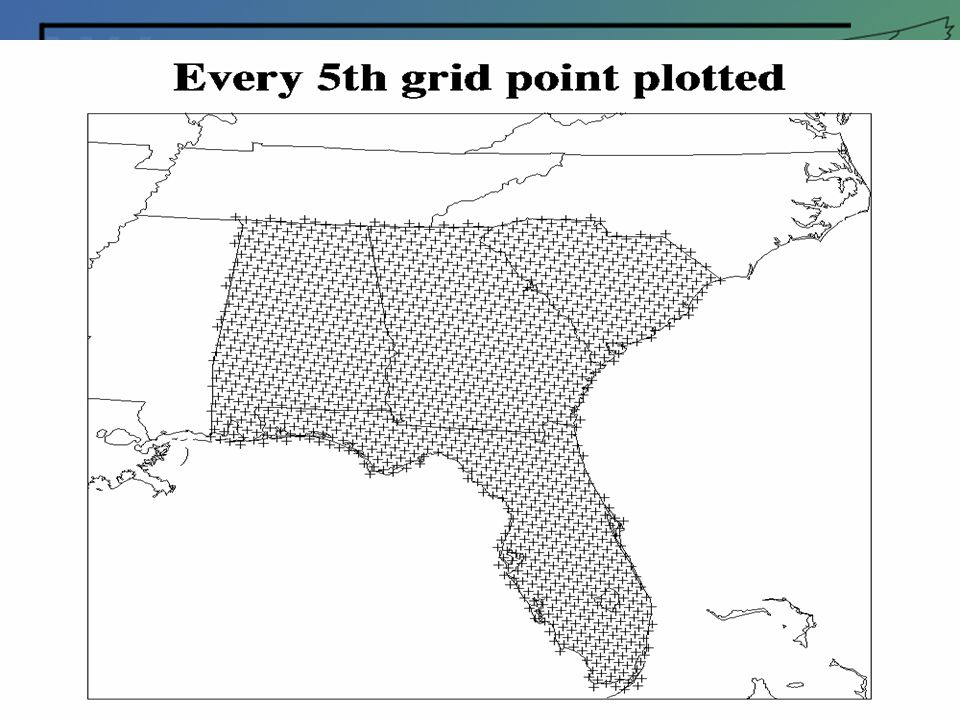
Developing Next Generation Agricultural Drought Index Using Crop Models and High Resolution Radar and Insolation Incorporates both physical inputs and the physiological state of the crop DSSAT run in a gridded mode DSSAT driven by High resolution (4km) radar derived precipitation High resolution (4 km) satellite derived insolation High resolution gridded tmin and tmax
 radar derived precipitation High resolution (4 km) satellite derived insolation High resolution gridded tmin and tmax")
30
Radar derived rainfall Satellite derived insolation

32
Dry Year Wet Year Water stress from DSSAT for corn simulation

61
We believe the DSSAT derived spatial drought index has great potential for determining drought impacts in agriculture. Forward runs of DSSAT to maturity can provide running estimate of yields. DSSAT run with observed data DSSAT run with forecast data (e.g. ENSO phase years) Current Day
 Current Day.")
62
Thank You! Support Provided by USDA Risk reduction in SE Agriculture (FSU) NOAA RISA (U. Miami) NOAA Drought Studies (UAH)
 NOAA Drought Studies (UAH).")
63
In filling off-stream reservoirs how much water can be withdrawn from a stream or river without adversely impacting the ecology? Reservoirs filled during winter high flows. But flood events and flood plain inundation important to reproduction cycles sediment deposition Nitrogen sequestration

64
Are critical flood characteristics preserved ? Inundation depth Inundation area Inundation time Goal: Withdrawals limited so that the above parameters are not significantly altered in a statistical sense (95% confidence interval)
.")
65
GIS Area Model

66
Rating Curve Rating curve based on USGS data Relates discharge (known) to gage height (needed) USGS provides table of Discharge versus Gage Height Estimated gage height in region of interest (approximately 4.5 miles downstream of Elrod station) Interpolation routine for Rating data is statistically accurate. Currently have rating data 11 & 12 (1995 – present).
..")
67
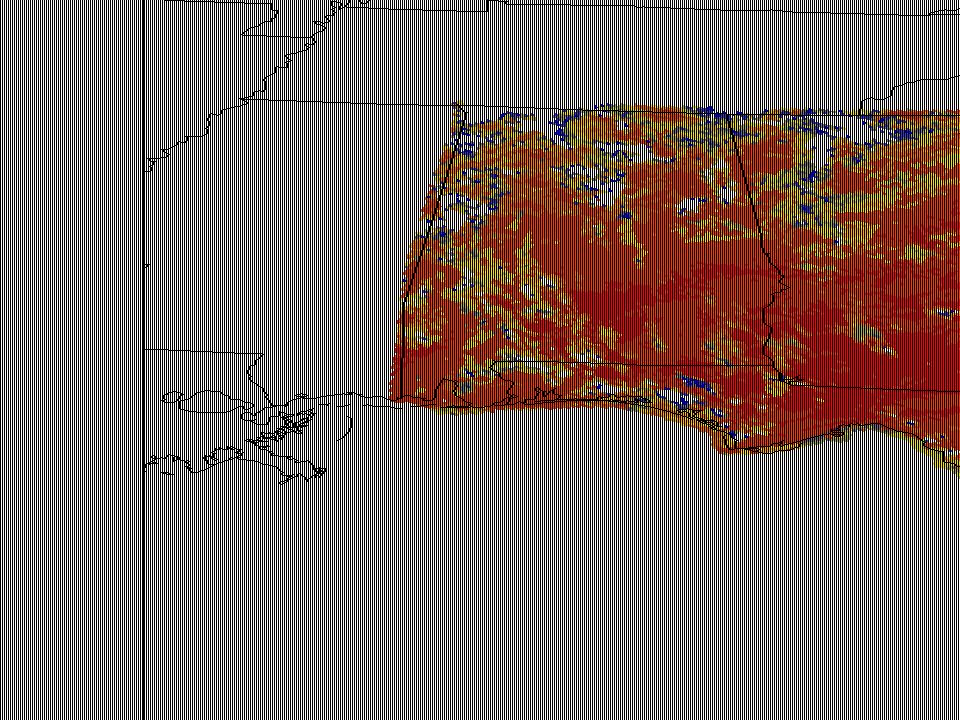
2001 365-day Analysis Before withdrawal in orange (burnt?) After withdrawal in blue (39.5% of discharge withdrawn) This was the highest flow day during withdrawal period (January through April)
 After withdrawal in blue (39.5% of discharge withdrawn) This was the highest flow day during withdrawal period (January through April)")
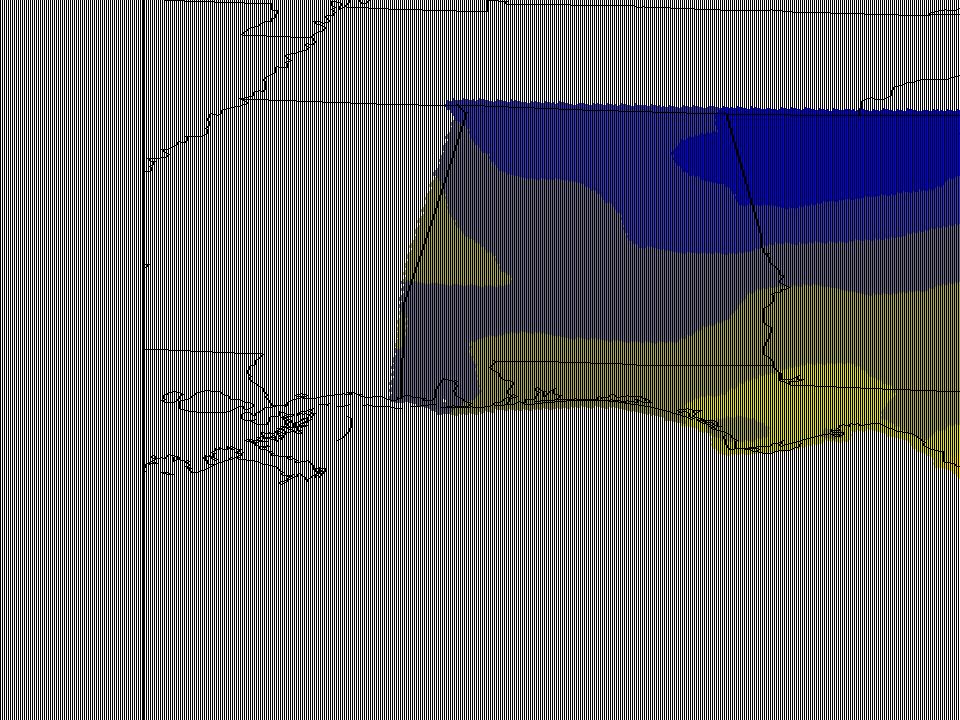
68
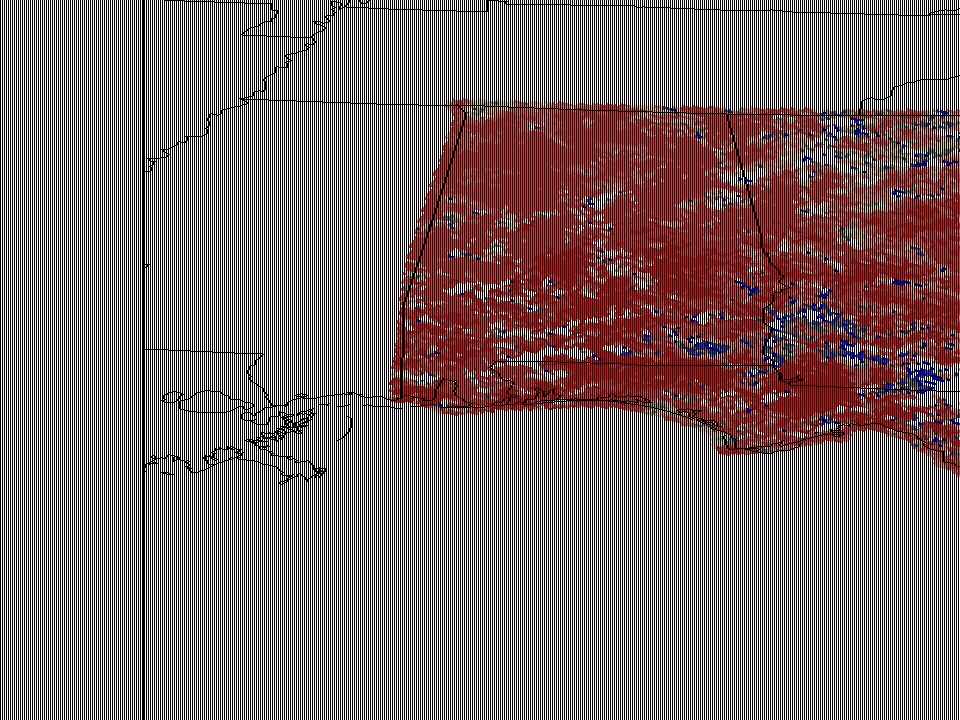
2001 120-day Analysis Before withdrawal in orange… After withdrawal in blue (16.7% of discharge withdrawn) This was the highest flow day during withdrawal period (January through April)
 This was the highest flow day during withdrawal period (January through April)")
69
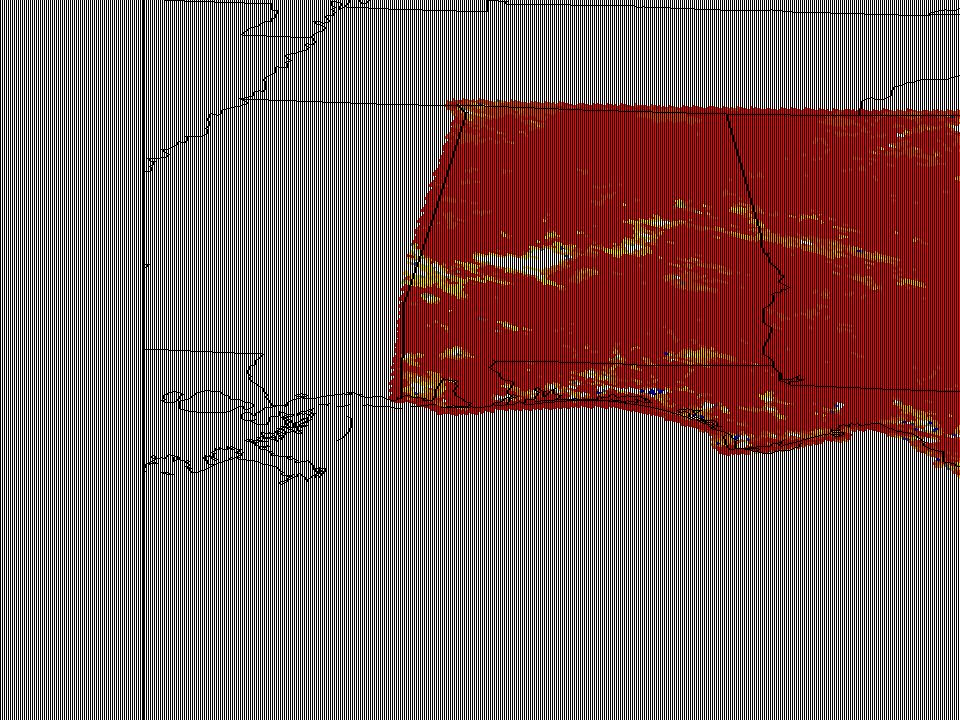
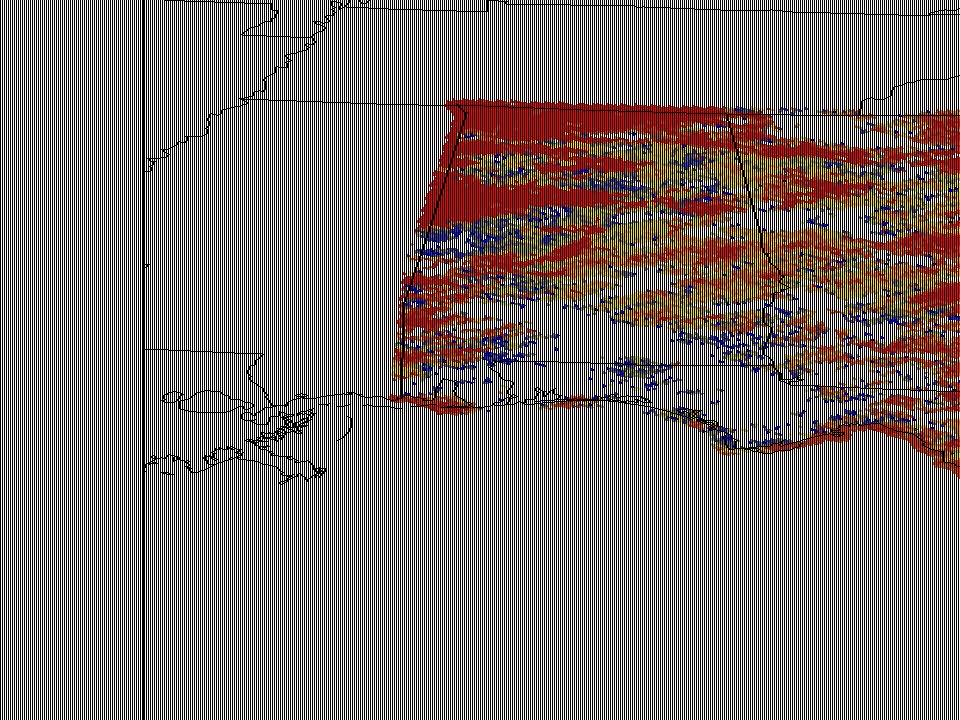
Approximate Area before/after Synthetic Withdrawal

Similar presentations


Impact on fresh water resources 1. Change in precipitation – Increase flooding – Increase in northern high latitude during the winter, and south-east.>")

