Download presentation
Presentation is loading. Please wait.

1
Dynamical System of a Two Dimensional Stoichiometric Discrete Producer-Grazer Model : Chaotic, Extinction and Noise Effects Yun Kang Work with Professor Yang Kuang and Professor Ying-chen Lai, Supported by Professor Carlos Castillo-Chavez (MTBI) and Professor Tom Banks (SAMSI)
 and Professor Tom Banks (SAMSI)")
2
Outline of Today’s Talk Introduce LKE – model, and its corresponding discrete case; Mathematical Analysis: bifurcation study Biological Meaning of Bifurcation Diagram; Chaotic behavior and Extinction of grazer; Nature of Carry Capacity K and Growth Rate b, and their fluctuation by environments: adding noise Interesting Phenomenal by adding noise: promote diversity of nature Conclusion and Future Work

3
Stoichiometry It refers to patterns of mass balance in chemical conversions of different types of matter, which often have definite compositions

4
most important thing about stoichiometry we can not combine things in arbitary proportions; e.g., we can’t change the proportion of water and dioxygen produced as a result of making glucose.

5
Energy flow and Element cycling are two fundamental and unifying principles in ecosystem theory Using stoichiometric principles, Kuang’s research group construct a two-dimensional Lotka–Volterra type model, we call it LKE- model for short

6
Assumptions of LKE Model Assumption One: Total mass of phosphorus in the entire system is closed, P ( mg P /l ) Assumption Two: Phosphorus to carbon ratio (P:C) in the plant varies, but it never falls below a minimum q (mg P/mg C); the grazer maintains a constant P:C ratio, denoted by ( mg P/mg C ) Assumption Three: All phosphorus in the system is divided into two pools: phosphorus in the plant and phosphorus in the grazer.
 Assumption Two: Phosphorus to carbon ratio (P:C) in the plant varies, but it never falls below a minimum q (mg P/mg C); the grazer maintains a constant P:C ratio, denoted by ( mg P/mg C ) Assumption Three: All phosphorus in the system is divided into two pools: phosphorus in the plant and phosphorus in the grazer.")
7
Continuous Model p is the density of plant (in milligrams of carbon per liter, mg C/l); g is the density of grazer (mg C/l); b is the intrinsic growth rate of plant (day−1); d is the specific loss rate of herbivore that includes metabolic losses (respiration) and death (day−1); e is a constant production efficiency (yield constant); K is the plant’s constant carrying capacity that depends on some external factors such as light intensity; f(p) is the herbivore’s ingestion rate, which may be a Holling type II functional response.
; g is the density of grazer (mg C/l); b is the intrinsic growth rate of plant (day−1); d is the specific loss rate of herbivore that includes metabolic losses (respiration) and death (day−1); e is a constant production efficiency (yield constant); K is the plant’s constant carrying capacity that depends on some external factors such as light intensity; f(p) is the herbivore’s ingestion rate, which may be a Holling type II functional response.")
8
Biological Meaning of Minimum Functions K controls energy flow and (P − y)/q is the carrying capacity of the plant determined by phosphorus availability; e is the grazer’s yield constant, which measures the conversion rate of ingested plant into its own biomass when the plants are P rich ( ); If the plants are P poor ( ), then the conversion rate suffers a reduction.
/q is the carrying capacity of the plant determined by phosphorus availability; e is the grazer’s yield constant, which measures the conversion rate of ingested plant into its own biomass when the plants are P rich ( ); If the plants are P poor ( ), then the conversion rate suffers a reduction.")
9
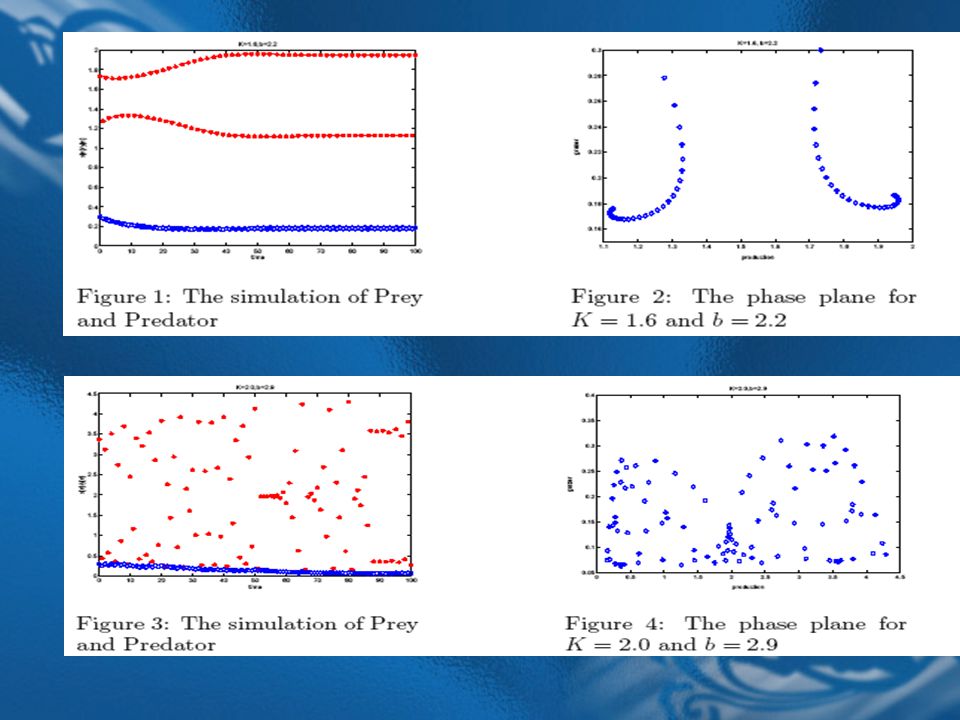
Continuous Case: b=1.2 and b=2.9

10
Discrete Model From Continuous One Motivation: Data collect from discrete time, e.g., interval for collecting data is a year. Biological Meaning of Parameters : Modeling the dynamics of populations with non-overlapping generations is based on appropriate modifications of models with overlapping generations. Choose

12
Mathematical Analysis We study the local stability of interior equilibrium E*=(x*,y*)
")
13
Bifurcation Diagram and Its Biological Meaning For continuous case: K=1.5

14
Bifurcation Diagrams on Parameter b

16
Bifurcation Diagrams on Parameter K

17
Relationship Between K and b: From these figures, we can see that there is nonlinear relationship between K and b which effect the population of plant and grazer: For bifurcation of K, increasing the value of b, the diagram of b seems shrink. For bifurcation of b, increasing the value of K, bifurcation diagram seems move to the left

18
Extinction of Grazer From bifurcation diagram, we can see that for some range of K and b, grazer goes to extinct. What are the reasons?

19
Basin Boundary For Extinction

20
Global Stability Conjecture We know that Discrete Rick Model : x(n+1)=x(n)exp{b(1-x(n)/K)} has global stability for b<2, does our system also has this properties More general, if we have u(n+1)=u(n)exp{f(u(n),0} with global stability, then the following discrete system: x(n+1)=x(n)exp{f(x(n),y(n))+g(x(n),y(n))}, of g(x,y) goes to zero as y tending to zero, in which condition has global stability
=x(n)exp{b(1-x(n)/K)} has global stability for b<2, does our system also has this properties More general, if we have u(n+1)=u(n)exp{f(u(n),0} with global stability, then the following discrete system: x(n+1)=x(n)exp{f(x(n),y(n))+g(x(n),y(n))}, of g(x,y) goes to zero as y tending to zero, in which condition has global stability")
21
Nature of K and b K is carrying capacity of plant, and it is usually limited by the intensity of light and space. Since K is easily affected by the environment, it will not be always a constant ; b is maximum growth rate of plant, it will fluctuates because of environment changing.

22
Adding Noise Because of the nature of biological meaning of K and b, it makes perfect sense to think these parameters as a random number. We let K=K0+ w*N(0,1) b=b0+w*N(0,1)
 b=b0+w*N(0,1).")
23
Then Most Interesting thing on parameter K : Prevent extinction of grazer :

24
Time Windows

25
Scaling Define the degree of existence : R=average population of graze/ average population of plant Then try different amplititute of noise w, then do the log-log scaling, it follows the scaling law.

26
Future Work We would like to use “snapshot” method to see how noise effects the population of grazer and producer; Try to different noise, e.g. color noise, to see how the ‘color’ effect the extinction of the grazer;

Similar presentations


 Predator-prey cycles Models of predation>")


 Sandi Merchant D-dudes meeting November 21, 2005.>")

 with the biotic world (life). A. First talk about “Ecosystems”, and generally.>")

 = bacteria density.>")


,>")


