Download presentation
Presentation is loading. Please wait.

1
Bow River Phosphorus Management Plan October 2012

2
What is the Phosphorus Management Plan? Stakeholders volunteering to manage phosphorus together

3
Too much phosphorus…is not a good thing Macrophytes on the Bow River

5
Why now? Long-term solutions needed Continued population pressure Cumulative effects management

6
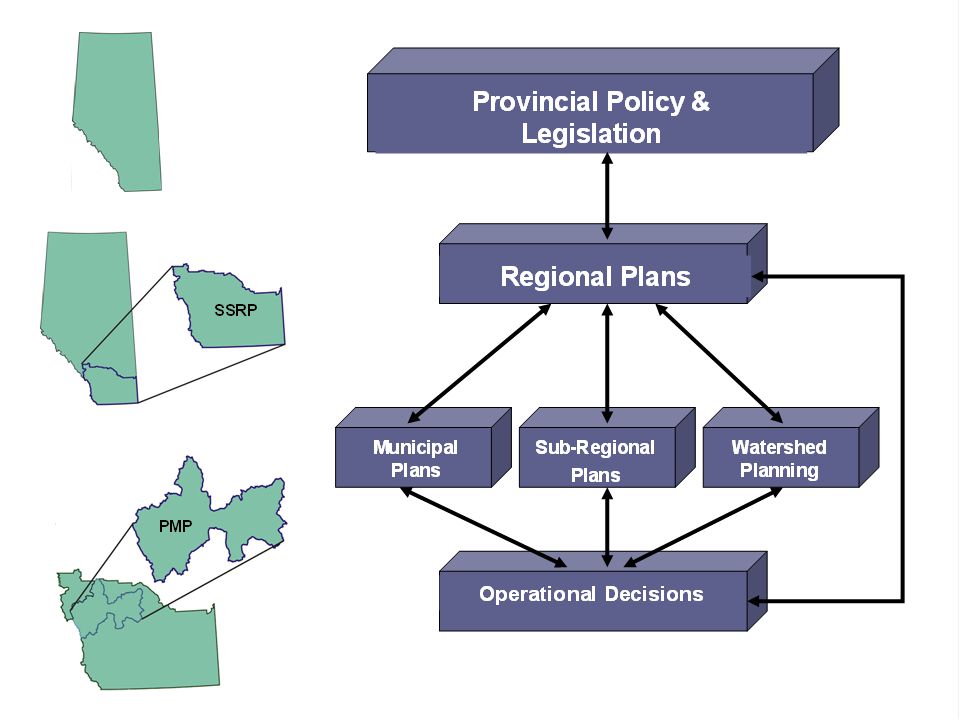
The Bow Basin Watershed Management Plan established watershed outcomes (qualitative) and water quality objectives (quantitative). How will this Phosphorus Management Plan link to watershed management planning of the Bow River Basin Council?

8
LevelDescriptionManagement Intent Level 3Exceedance of water quality limits. Mandatory management action. Evaluation and implementation of management options. Limit Level 2Exceedance of water quality triggers. Management response and determination of need for management action Investigation of cause and effects and evaluation and implementation of management options, if required. Trigger Level 1Mean and peak water quality conditions at or better than historic water quality conditions. Ongoing implementation of existing management approaches All licencees operate normally under approval conditions and all existing water, wastewater and aquatic ecosystem policies apply. Regional Plans and Water Quality Frameworks

9
- Bow River Monthly Water Quality Monitoring Sites (5) -Upper site at Banff is monitored by Environment Canada; 4 lower sites monitored by ESRD
 -Upper site at Banff is monitored by Environment Canada; 4 lower sites monitored by ESRD")
10
Why this reach? Land use pressure Increasing population pressure Significant P inputs from multiple sources Primary concern of multiple stakeholders Water quality model available

12
Dissolved Bound Dissolved Death Settling Diffusion Death Growth Photosynthesis Respiration Dissolved Oxygen CBOD Sediment Water Phosphorus

13
Open Water Mean Daily Load = 850 kg/d Ice Cover Mean Daily Load = 298 kg/d What do the monitoring results show?

14
Bow River Phosphorus Management Pla Phosphorus Management PlanVision: Phosphorus levels in the Bow will be managed within a range that meets the needs of its stakeholders and provides a healthy aquatic ecosystem

15
Bow River Phosphorus Management Plan Objectives: Accommodate future growth & development and meet water quality objective Create a plan for collective action, accountability and responsibility for all the stakeholders (point and non- point sources) Enable management actions to meet social, economic and environmental outcomes
 Enable management actions to meet social, economic and environmental outcomes")
16
Strategies and actions Technical and management tools Monitoring, evaluation and reporting structures Implementation roles, responsibilities and timelines The Phosphorus Management Plan will include:

17
Who’s involved?

18
Bow River Phosphorus Management Plan – Team Structure

19
Excess phosphorus doesn’t reach the water Water quality is improved for everyone’s use Beneficial management practices are being used Stakeholders are working together to solve the problem What does successful implementation look like?

21
How can you help?

Similar presentations


 Greenwich,>")


