Download presentation
Presentation is loading. Please wait.

1
Materials Plastics

2
Introduction

3
What are Plastics Polymer
“Poly” – many “mer” – unit Many Units Carbon based, high molecular weight, versatile synthetic materials that are built up from monomeric units

4
How plastics are made Addition or Condensation Reaction Addition
A simple combining of molecules without generating byproducts Vinyls PE PP PS

5
Addition Reaction - Polyethylene

6
How plastics are made Condensation
Involves removing certain atoms from each molecule, allowing the molecules to combine Byproducts are generated that must be removed Nylons PC

7
Condensation Reaction - Polycarbonate

8
Types of Plastics Thermoplastic Thermoset
Soften with heated, then solidify when cooled Only physical changes Thermoset Polymers that chemically react when heated to form a cross-linked polymer chain network Not reformable with heating

9
Thermoplastics Amorphous Semi-Crystalline Random Structure Tg
Polystyrene, Polycarbonate Semi-Crystalline Organized Molecular Arrangement Tg, Tm Polyethylene, Polypropylene

10
Crystallinity

11
Thermoplastics The ability of plastics to form crystals is largely dependent on the structure of the plastic molecule Linear plastics with small side groups can form crystalline regions HDPE, LDPE, Acetals, Nylon and PET

12
Structure Property Relationship
The Property of a Plastic Material formulation can be tailored to meet most end use applications The properties are dependent on The chemical composition of the polymer Additives

13
Structure Property Relationship
Chemical Composition varies by Structure of the repeat unit Average molecular weight Molecular weight distribution Linear, branched or cross-linked

14
Structure Property Relationship
PMMA and PS are very different in behavior and properties because their repeat units are different

15
Molecular Distribution

16
Structure Property Relationship
Number-Average Molecular Weight (Mn) Mn = NiMi / Ni where Ni is the number of molecules of the ith species of molecular weight Mi. Measured from colligative properties such as: freezing point depression for low molecular weight osmotic pressure for higher molecular weight gel permeation or size exclusion chromatography
 Mn = NiMi / Ni. where Ni is the number of molecules of the ith species of molecular weight Mi. Measured from colligative properties such as: freezing point depression for low molecular weight. osmotic pressure for higher molecular weight. gel permeation or size exclusion chromatography.")
17
Structure Property Relationship
Weight-Average Molecular Weight (MW) MW= NiMi2/ NiMi where Ni is the number of molecules of the ith species of molecular weight Mi. Measured using techniques such as: light scattering gel permeation or size exclusion chromatography.
 MW= NiMi2/ NiMi. where Ni is the number of molecules of the ith species of molecular weight Mi. Measured using techniques such as: light scattering. gel permeation or size exclusion chromatography.")
18
Structure Property Relationship
Polydispersity(MWD) = MW / Mn A measure of the distribution of molecular weights of polymer chains.
 = MW / Mn. A measure of the distribution of molecular weights of polymer chains.")
20
Effect of Mw on Viscosity
Low shear – lots of entanglements, Mw has direct effect on viscosity Medium shear – reduced entanglements Mw has less effect on viscosity High shear – few entanglements, Mw has no effect on viscosity Low Shear Medium Shear High Shear Log Log Log shear rate

21
Effects of MWD on Viscosity
Narrow MWD Viscosity Broad MWD Shear Rate

22
Structure Property Relationship
Additives Used to enhance specific properties Combustion modifiers Release agents Blowing Agents UV stabilizers Fillers Reinforcements Colors Additives are like medications, they have side effects

23
Plastics Behavior and Properties

24
Plastics Behavior and Properties
Mechanical Behavior Flow Behavior Short Term Mechanical Properties Long Term Mechanical Properties Thermal Properties Electrical Properties Environmental Properties Other Properties

25
Mechanical Behavior Viscoelasticity Creep Stress Relaxation Recovery
Loading Rate

26
Viscoelasticity Elastic Viscous Plastics show both responses
The material returns to original shape after the load has been removed Linear stress strain response Viscous The material will deform or flow under load Nonlinear stress-strain response Plastics show both responses Short term load elastic Long term load viscous

27
Creep One of the most important results of plastics’ viscoelastic behavior Deformation over time when a material is subjected to a constant stress The polymer chains slip past one another Some of the slippage is permanent

28
Creep

29
Stress Relaxation Gradual decrease in stress at constant strain
Same polymer chain slippage as in creep

30
Recovery The degree to which a plastic returns to its original shape after a load is removed

31
Temperature and Loading Rate Effects
The rate at which the part is stressed or strained Thermoplastics become stiffer and fail at smaller strain levels as the strain rate increases At higher temperatures plastics lose their stiffness and become more ductile

32
Temperature and Loading Rate Effects

33
Flow

34
Types of Flow Drag Flow Caused by the relative motion of one boundary with respect to the other boundary that contains the fluid Two major boundaries in injection unit are the barrel and screw surfaces Since the screw is rotating in a stationary barrel, one boundary is moving relative to the other boundary This causes drag flow to occur

35
Types of Flow Pressure Flow
Caused by the presence of pressure gradients Pressure flow is what occurs downstream of the injection unit Sprue, runner, gate and cavity Flow occurs because the pressure is higher at the injection unit discharge than in the mold

36
Types of Flow For the overall system
The injection unit uses drag flow to move the material and build pressure This pressure buildup at the discharge of the injection unit results in pressure flow through the mold

37
Shear Flow Induced by Drag Flow
Different layers of plastics move at different velocities with the maximum velocity being at the moving boundary and zero velocity at the wall

38
Shear Flow Induced by Pressure Flow
Different layers of plastics move at different velocities with the maximum velocity being at the centerline of flow and zero velocity at the walls

39
Shear Rate Difference in velocity per normal distance
The change in shear strain with time Units of seconds-1 Drag Flow Pressure Flow

40
Shear Stress The stress required to achieve a shearing type flow
Force divided by the area over which it acts Units of Pascal or psi Drag Flow Pressure Flow

41
Shear Viscosity Internal resistance to shear flow
Ratio of shear stress to shear rate Units of poise or Pa-sec

42
Shear Heat Viscous heat generation Heat generated due to shear flow
Conversion of mechanical energy to heat through friction Amount is equal to the product of the viscosity and the shear rate squared

43
Effect of Temperature on Viscosity

44
Types of Fluids Newtonian Shear thinning(pseudo-plastic)
A fluid whose viscosity is independent of shear rate Shear thinning(pseudo-plastic) A fluid whose viscosity decreases with increasing shear rate Shear thickening(dilatants) A fluid whose viscosity increases with increasing shear rate
 A fluid whose viscosity decreases with increasing shear rate. Shear thickening(dilatants) A fluid whose viscosity increases with increasing shear rate.")
45
Flow Behavior

46
Power law Fluids Polymer melts are shear thinning fluids
The fact that the viscosity reduces with shear rate is of great importance in the injection molding process Important to know the extent of the change of viscosity with shear rate m is the consistency index n is the power law index

47
Mechanical Properties

48
Mechanical Properties
Important in all applications Stiffness Hardness Toughness Impact Strength The ability to support loads

49
Mechanical Properties
Mechanical property data is used to Select materials Estimate part performance Predict deformation and stresses from applied loads

50
Mechanical Properties
Most data have been derived from laboratory tests and may not directly apply to your application Data should be used for comparison purposes only because Difference between testing and end use conditions Material and processing variability Unforeseen environmental or loading conditions

51
Types of Forces There are four fundamental forces we deal with in the testing of mechanical properties of plastics Tensile Compressive Shear Torsion These forces are tested alone and in combinations

52
Tension and Compression Forces
Pulling force Compression Pushing force

53
Shear and Torsion Force
Opposing forces at the same point Torsional Force Turning force

54
Stress and Strain Stress is the force per area that is applied to the specimen Units of psi or Pa Strain is the change is dimension divided by the original dimension No units

55
Stress-Strain

56
Terms and Definitions Proportional Limit Elastic Limit
The end of the region where the plastic shows linear stress-strain behavior Elastic Limit The point after which the plastic will permanently deform Applications that cannot tolerate permanent deformations must stay under the elastic limit

57
Terms and Definitions Yield Point
Marks the beginning of the region in which the ductile plastic continues to deform without a corresponding increase in stress Elongation at yield gives the upper limit for application that can tolerate a small deformation

58
Terms and Definitions Break Point Ultimate Strength
Shows the strain value at which the test bar breaks Ultimate Strength Measures the highest stress value Used for general strength comparisons

59
Terms and Definitions Elastic Modulus
The slope of the linear region of the stress-strain curve Ratio of stress-strain response Used to compare materials and make structural calculations Units of psi or Pa

60
Short Term Mechanical Test
Tensile Flexural Compressive Impact Hardness Coefficient of Friction

61
Tensile Tester Measures a plastics stiffness
After the test bar is clamped in the jaw, the jaws then move at a constant rate of separation The force required for movement is recorded

62
Tensile Test Data Tensile Modulus measure a plastics stiffness
Used for comparisons and structural calculations The higher the modulus the greater the stiffness Tensile stress at yield establishes an upper limit for applications that can tolerate a small permanent deformation

63
Tensile Test Data Elongation at yield is the strain value at the yield point Determines the upper limit for application that can tolerate small permanent deformations Tensile Stress at Break is the stress applied at the time of fracture Establishes an upper limit for One time use applications that fail due to fracture Parts that can still function with large deformations

64
Tensile Test Data Elongation at Break measures the strain at fracture as a percentage of elongation Useful for applications that fail by fracture Ultimate Strength measures the highest stress value during the tensile test Useful for comparing general strengths between plastics Ultimate Elongation is the elongation at the breaking point

65
Stress Strain Curves

66
Stress Strain Curves

67
Poisson’s Ratio Parts subjected to tensile or compressive stress deform in two directions Poisson’s Ratio measures the lateral to longitudinal strains

68
Poisson’s Ratio Usually between 0.35 to 0.42 for plastics
Required for many structural analysis calculations

69
Flexural Tester

70
Flexural Test Data Flexural Modulus is the ratio of stress to strain in the elastic region of the stress strain curve Measures the plastics stiffness in bending Compressive and tensile forces are both measured as a result of bending Used in bending structural calculations Test values for tensile modulus correspond well with flexural modulus for solid plastics

71
Flexural Test Data Ultimate Flexural Stress is the highest value of stress on the stress-strain curve Measures the level after which severe deformation or failure will occur

72
Flexural Properties

73
Compressive Tester Measures a materials hardness
The test specimen is compressed at a constant strain rate between two parallel platens until it ruptures or deforms by a certain percentage

74
Compressive Test Data Shows a materials hardness and load capabilities
Compressive Strength measures the maximum compressive stress recorded during the test Useful in structural calculations for load bearing applications

75
Compressive Properties

76
Shear Strength Measures the shearing force required to make holes or tears in the plastic Useful in structural calculations for parts that may fail in shear Data does not account for stress concentrations or mold-in stresses

77
Tear Strength The force required to rip the plastic divided by the thickness Provides relative data for comparing materials

78
Impact Tester

79
Impact Test Impact Strength measures a plastics ability to absorb and dissipate energy Hard to relate at actual part performance Part geometry Temperature Stress concentrations Molding stresses Impact speed

80
Impact Tests Izod is most widely used
Uses horizontally notched sample to concentrate impact Charpy uses a vertically notched sample Use for comparing materials relative impact strength

81
Tensile and Impact Impact Strength and Tensile Modulus provide insight into a plastics mechanical nature High impact strength and large tensile modulus suggest a tough material High impact strength and small tensile modulus indicates a ductile, flexible material Low Impact strength and a large tensile modulus typify a brittle material

82
Hardness Tester A load is applied to an indentor, which presses against the plastic

83
Hardness Data

84
Abrasion Resistance Abrasion Resistance is measured by applying a Taber Abrader with 250gr weight and a CS 10-F textured abrader to a test specimen for a set number of cycles Then measuring the changes in volume and transparency

85
Abrasion Resistance Data

86
Coefficients of Friction
Ratio of the friction force, the force needed to initiate sliding, to the normal force, the force perpendicular to the contact surface

87
Coefficients of Friction (Static) Ranges for Various Materials
 Ranges for Various Materials")
88
Long Term Mechanical Properties
Creep Stress Relaxation Fatigue

89
Creep Short Term testing gives us data for periodic loading
It is not unusual for plastic parts to be subjected to continuous loading or loads that last a long time The viscous nature of plastics make these long term loading to be of interest even if small Creep is the deformation or strain due to viscous or cold flow To design parts that are subjected to long term loading, the designer must utilize creep data

90
Examples of Creep

91
Creep The time and temperature dependent creep modulus of a polymer is
Manufacturers generate creep data by subjecting molded test specimen to varying stress level and measuring the change in dimension over time

92
Creep Data

93
Creep Sample Problem How much would the material be strained after 1000 hours at a constant stress of 2800 psi?

94
Stress Relaxation Stress relaxation data is used for applications where strain levels remain constant over a long period of time When plastics are stretched, compressed, bent or sheared to a fixed value of strain, the stress value decrease with time due to the viscous effects(molecular relaxation)
")
95
Stress Relaxation Examples

96
Stress Relaxation The time and temperature dependent relaxation modulus of a polymer is Stress relaxation data is generated by applying a fixed strain to molded samples and measuring the gradual decrease in stress with time

97
Stress Relaxation Data

98
Stress Relaxation Sample Problem
What is the stress of the polycarbonate after 104 hours at a 2% constant strain?

99
Fatigue Fatigue properties are used when designing parts that are subjected to repeated or cyclic loadings Tests are ran in bending, torsion and tension

100
Fatigue Curves

101
Fatigue Example Problem
What is the amount of stress that will lead to failure after 1 million cycles for Tensile = 34N/m2 Bending = 38N/m2

102
Thermal Properties

103
Thermal Properties Glass Transition Temperature Melting Temperature
Coefficient of Thermal Expansion Deflection Under Load Thermal Conductivity Specific Heat Vicat Softening Temperature

104
Glass Transition and Melting Temperature
Specific volume vs temperature provides Tm = melting temperature Tg = glass transition temperature

105
Melting Temperature While cooling the melt, the specific volume of the melt sharply drops at a temperature which is termed as Tm. This is due to the crystalline regions forming Only for semi-crystalline plastics

106
Glass Transition Temperature
While cooling non-crystalline polymer melt there is no sharp drop in specific volume and the melt becomes highly viscous and it appears like solid. Since the glass behaves in this manner the temperature at which the specific volume curve changes its slope is called Tg- glass transition temperature.

107
Glass Transition Temperature
Polymer becomes : hard, stiff and brittle below Tg highly viscous but solid at Tg rubbery, flexible and softer above Tg Both amorphous and semi-crystalline plastics have Tg

108
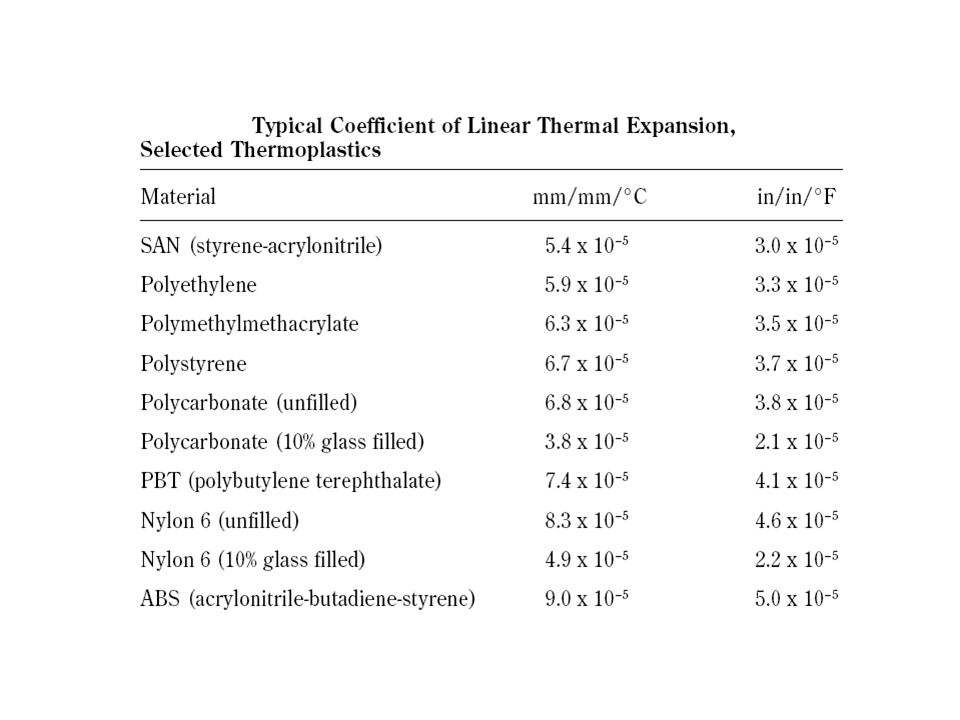
Coefficient Of Linear Thermal Expansion
Measures the change in length per unit length of a material per unit change in temperature Expressed in in/in/°F or cm/cm/°C Used to calculate the dimensional change resulting from thermal expansion Very important when components of an assembly are made of different materials

111
Heat Deflection Under Load
Used to compare elevated temperature performance of plastics under load Temperature requirements often limit plastics choice more than any other factor Does not represent the upper temperature limit Molding factors, sample preparation and thickness significantly affects the values

112
Heat Deflection Under Load
The test bar is loaded on a support, the temperature raises until the applied load causes the bar to deflect

113
Vicat Softening Temperature
Ranks the thermal performance of plastics according to the temperature that causes a specified penetration by a lightly loaded probe Used as a general indicator of short term, high temperature performance Less sensitive to sample thickness and molding effects Often used as the ejection temperature

114
Vicat Softening Temperature
A flat ended probe contacts a plastic specimen submerged in a heated oil bath A specified load is applied and the temperature is increased Temperature of the oil bath when penetration takes place

115
Thermal Conductivity Indicates a materials ability to conduct heat energy Measured in Btu*in/(hr*ft2*°F) or W/(°K*m) Used to calculate heating and cooling requirements in mold filling, thermal insulation or heat dissipation analysis

116
Thermal Conductivity Data

117
Specific Heat Reflects the heat required to cause a one degree temperature change in a unit mass of material Measured in Btu/lb/°F or KJ/kg/°C Used in heat transfer calculations from mold filling and cooling analysis

118
Electrical Properties

119
Electrical Properties
Resistivity Dielectric Dissipation Arc Resistance

120
Resistivity Measure of a plastics electrical insulating properties
Used to compare plastics as electrical insulators Indicates current leakage through an insulating body Should be at least 108 ohm*cm to be considered an insulating material

121
Volume Resistivity Data

122
Dielectric Strength and Constant
Dielectric Strength measures the voltage an insulating material can withstand before electrical breakdown occurs Best indicator of a material’s insulating capabilities Measured in volts per mil of thickness Higher values indicate better insulating characteristics

123
Dielectric Strength Data

124
Dielectric Strength and Constant
The Dielectric Constant is the ratio of the capacitance of a plate electrode system to a test specimen Lower values indicated better insulating characteristics

125
Dissipation Factor Measures a plastics tendency to convert current into heat Important in applications such as radar and microwave equipment that run at high frequencies Lower values indicate less power loss and heat generation

126
Arc Resistance Measures the number of seconds a plastics surface will resist forming a continuous conductive path while being exposed to high voltage electric arc Plastics with higher values are used in closely spaced conductors, circuit breaker and distributor cap applications

127
Environmental Properties

128
Environmental Properties
Pay close attention to the environment to which the part will be exposed during Processing Secondary Operations Assembly End Use Chemical exposure and weather conditions may determine which plastic you choose

129
Environmental Properties
Water Absorption Hydrolytic Degradation Chemical Resistance Weatherability Gas Permeability

130
Water Absorption Plastics absorb water to varying degrees, depending on their molecular structure, fillers and additives Adversely affects both mechanical and electrical properties and causes swelling Measures the amount of water absorbed as a percent of total weight

131
Hydrolytic Degradation
Exposing plastics to moisture at elevated temperature can lead to hydrolysis A chemical process that severs polymer chains by reacting with water Reduces the molecular weight and degrades the plastic Degree of degradation depends on Exposure time Temperature Stress levels

132
Chemical Resistance Chemical Resistance of a plastic depends on
The chemical Exposure time and temperature Stress level Type of chemical attack varies with the plastic and the chemical Degradation Stress cracking Swelling Consider all substances a part will encounter Manufacturing Assemble Storage End Use

133
Weatherability Plastics in outdoor use are exposed to weather that can affect the performance of the part Ultraviolet radiation can cause embrittlement, fading and surface cracking Actual and accelerated testing Additives and higher molecular weight can improve stability

134
Gas Permeability Measures the amount of gas that can pass through a plastic in a given time Used in packaging and medical applications, where the plastic forms a barrier

135
Other Properties

136
Other Properties Density Specific Gravity Specific Volume
Transmittance Refractive Index Flammability

137
Density Mass per unit volume
Useful in converting volume into part weight and cost calculations Expressed in lb/ft3 or Kg/m3

138
Specific Gravity The ratio of a material's density to the density of water Used in a variety of calculations and comparisons when relative weight matters

139
Specific Volume The reciprocal of density Measured in ft3/lb or m3/Kg

140
Density and Specific Volume Data

141
Transmittance Measures a material’s transparency
Haze is the percentage of transmitted light passing through a plastic that is scattered Luminous transmittance is the ratio of transmitted light to incident light

142
Transmittance Data

143
Refractive Index Ratio of light’s velocity in a vacuum to its velocity as it passes through a plastic Important in optical lens and light-pipe calculations

144
Refractive Index Data

145
Flammability Most Plastics need an additive to meet flame resistance ratings Oxygen Index measures the percentage of oxygen need to support flame in a plastic sample UL 94 Classes Established by Underwriter Laboratories to classify the burning behavior of plastics

Similar presentations


>")


 Professor Joe Greene CSU, CHICO.>")


Tensile strength>")