Download presentation
Presentation is loading. Please wait.

1
Bliss Area Sewage System Groundwater Monitoring Pete Ganzel Washington County Department of Public Health & Environment

2
Agenda System History System History Local Geology Local Geology Collection System Collection System Treatment System Treatment System MPCA Discharge Permit MPCA Discharge Permit Monitoring Monitoring Site Evaluation & Design Site Evaluation & Design Evaluation of Piezometer Data Evaluation of Piezometer Data Discussion Discussion Questions Questions

3
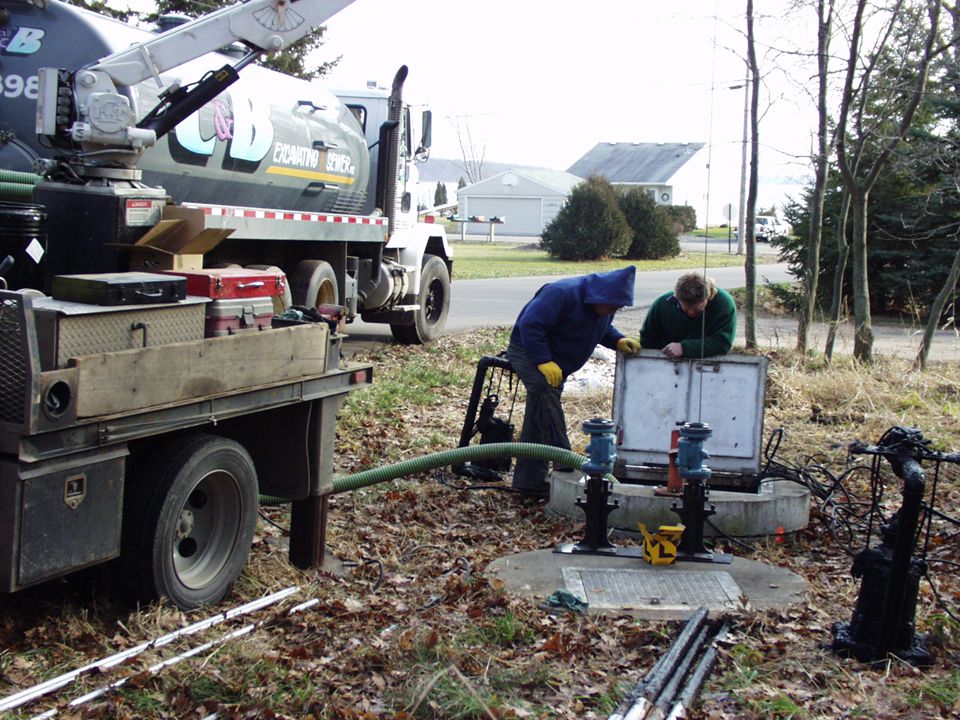
System Overview Historical Big Marine Lake Big Marine Lake Bliss, Holiday Beach Plats 1950s Bliss, Holiday Beach Plats 1950s Uncontrolled Flooding 70s and 80s Uncontrolled Flooding 70s and 80s Flood Control Flood Control 201 Program, Individual and Collector 201 Program, Individual and Collector Cost-$1.5 Million Cost-$1.5 Million System in Operation Since 1987 System in Operation Since 1987

5
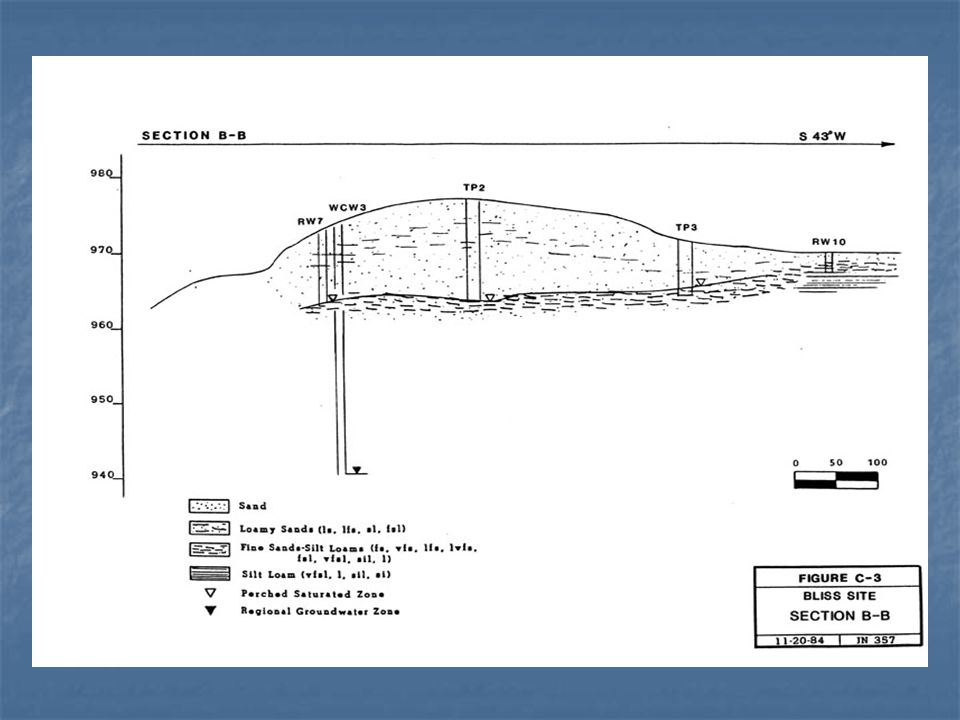
Local Geology St Croix Moraine St Croix Moraine Two Glaciations Two Glaciations Ice Block Lake Ice Block Lake Ice Walled Lake Sediments Ice Walled Lake Sediments Outwash Outwash Perched Shallow Aquifer Perched Shallow Aquifer

9
Additional site evaluation More rigorous analyses of More rigorous analyses of Site Site Soil Soil Stratigraphy Stratigraphy Hydrogeology Hydrogeology 7 additional pits (10 total) 7 additional pits (10 total) Field permeability testing Field permeability testing Lab characterization Lab characterization Shallow soil saturation monitoring (piezometers) Shallow soil saturation monitoring (piezometers)
 7 additional pits (10 total) Field permeability testing Field permeability testing Lab characterization Lab characterization Shallow soil saturation monitoring (piezometers) Shallow soil saturation monitoring (piezometers)")
10
Results from further site evaluation Site 10-20’ above nearby lake Site 10-20’ above nearby lake 30-40’ above Big Marine Lake 30-40’ above Big Marine Lake 15-30’ above springs 15-30’ above springs Depressional area on southern edge of proposed soil treatment area Depressional area on southern edge of proposed soil treatment area Lamellae bands common (19-250 cm/d) Lamellae bands common (19-250 cm/d) Saturated zone within 15’ of surface Saturated zone within 15’ of surface CONCLUSIONS: CONCLUSIONS: -site limitations for in-ground sewage treatment system, mounding likely an issue -site limitations for in-ground sewage treatment system, mounding likely an issue -Need to assess magnitude of mounding -Need to assess magnitude of mounding
 Lamellae bands common ( cm/d) Saturated zone within 15’ of surface Saturated zone within 15’ of surface CONCLUSIONS: CONCLUSIONS: -site limitations for in-ground sewage treatment system, mounding likely an issue -site limitations for in-ground sewage treatment system, mounding likely an issue -Need to assess magnitude of mounding -Need to assess magnitude of mounding")
11
Assessing Mounding Magnitude Horizontal hydraulic conductivity of overlying soils (275-500 cm/d) Horizontal hydraulic conductivity of overlying soils (275-500 cm/d) Analytical modeling (Khan et al., 1976) Analytical modeling (Khan et al., 1976) 22000 gpd 22000 gpd 350’ length x 100’ width 350’ length x 100’ width Vertical permeability (assumed negligible) Vertical permeability (assumed negligible) OUTPUT – 31.5’ mounding height OUTPUT – 31.5’ mounding height CONCLUSION: Further analysis required CONCLUSION: Further analysis required
 Horizontal hydraulic conductivity of overlying soils ( cm/d) Analytical modeling (Khan et al., 1976) Analytical modeling (Khan et al., 1976) gpd gpd 350’ length x 100’ width 350’ length x 100’ width Vertical permeability (assumed negligible) Vertical permeability (assumed negligible) OUTPUT – 31.5’ mounding height OUTPUT – 31.5’ mounding height CONCLUSION: Further analysis required CONCLUSION: Further analysis required")
12
Numerical modeling approach (Prickett- Lonnquist, Illinois State Water Survey) Numerical modeling approach (Prickett- Lonnquist, Illinois State Water Survey) More complex site parameters More complex site parameters Compared (validated) to ambient conditions and correlated to observed piezometer readings Compared (validated) to ambient conditions and correlated to observed piezometer readings 300 days = mounding height of 10.7’; 5 years = 11.3’ (near or at soil surface) 300 days = mounding height of 10.7’; 5 years = 11.3’ (near or at soil surface) Re-ran model with 50% flow (11000 gpd) Re-ran model with 50% flow (11000 gpd) Mounding height of 6.8’ (within 4’ of surface elevation) Mounding height of 6.8’ (within 4’ of surface elevation) Assessing Mounding Magnitude continued
 Numerical modeling approach (Prickett- Lonnquist, Illinois State Water Survey) More complex site parameters More complex site parameters Compared (validated) to ambient conditions and correlated to observed piezometer readings Compared (validated) to ambient conditions and correlated to observed piezometer readings 300 days = mounding height of 10.7’; 5 years = 11.3’ (near or at soil surface) 300 days = mounding height of 10.7’; 5 years = 11.3’ (near or at soil surface) Re-ran model with 50% flow (11000 gpd) Re-ran model with 50% flow (11000 gpd) Mounding height of 6.8’ (within 4’ of surface elevation) Mounding height of 6.8’ (within 4’ of surface elevation) Assessing Mounding Magnitude continued")
13
Overall Conclusions Site not suitable for flows, loading rates if in-ground soil treatment Site not suitable for flows, loading rates if in-ground soil treatment Alternative treatment options investigated Alternative treatment options investigated Treatment of water Treatment of water Infiltration rates Infiltration rates Lessen mounding threat to environment Lessen mounding threat to environment Ultimately alternative treatment employed Ultimately alternative treatment employed Monitoring of separation distances/mounding Monitoring of separation distances/mounding

14
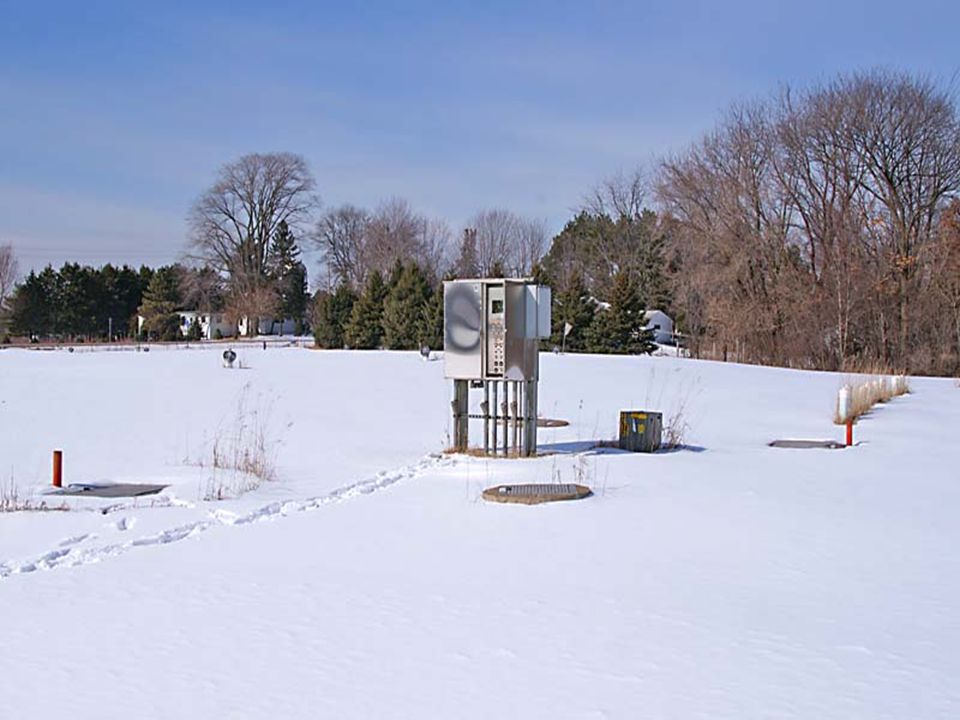
System Overview Collection System 75 Dwellings 75 Dwellings Septic Tanks Septic Tanks Shared Step Stations Shared Step Stations Gravity Mains Gravity Mains Two Main Lift Stations Two Main Lift Stations Force Mains Force Mains

18
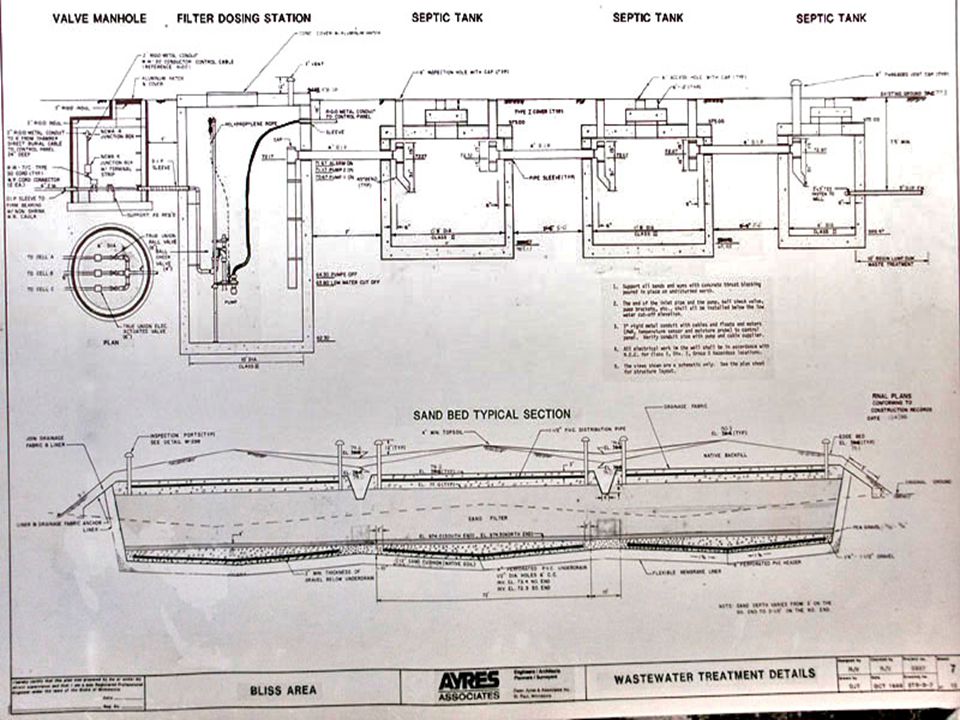
System Overview Treatment System 7500 Gallon Settling Tanks 7500 Gallon Settling Tanks Sand Filters and Dosing Station Sand Filters and Dosing Station Drainfields and Dosing Station Drainfields and Dosing Station

22
Incoming Effluent (LS3)
")
23
Sand Filter Effluent (LS4)
")
24
Guess Which?

25
MPCA Discharge Permit Requires Licensed Operator- Class D Facility Requires Licensed Operator- Class D Facility Renewed Every 5 Years Renewed Every 5 Years Goal: Protecting Water Quality Goal: Protecting Water Quality Reporting Reporting Monthly- Flow, Precipitation Monthly- Flow, Precipitation Permitted 19,800 gallons per day Permitted 19,800 gallons per day Quarterly- Groundwater Monitoring, Effluent Sampling Quarterly- Groundwater Monitoring, Effluent Sampling

26
Monitoring 9 Piezometers 9 Piezometers Groundwater/system separation (water level) Groundwater/system separation (water level) 8 Groundwater Monitor Wells 8 Groundwater Monitor Wells Groundwater Quality Groundwater Quality Nitrogen, Phosphorus, Chloride Nitrogen, Phosphorus, Chloride Effluent Sampling Effluent Sampling BOD- Biochemical Oxygen Demand BOD- Biochemical Oxygen Demand Waste Strength Waste Strength VOC- Volatile Organic Compounds VOC- Volatile Organic Compounds
 Groundwater/system separation (water level) 8 Groundwater Monitor Wells 8 Groundwater Monitor Wells Groundwater Quality Groundwater Quality Nitrogen, Phosphorus, Chloride Nitrogen, Phosphorus, Chloride Effluent Sampling Effluent Sampling BOD- Biochemical Oxygen Demand BOD- Biochemical Oxygen Demand Waste Strength Waste Strength VOC- Volatile Organic Compounds VOC- Volatile Organic Compounds")
27
Septic Tank Sand Filter PrecipBODTSSpHFecalBODTSSpHPFecal EColi Nitrate and Nitrate 2/1/20051.56 3/3/20051.06 4/5/20051.28127327.1510000327.44.884200 29 5/2/20051.24 6/1/20052.78 6/28/20054.44100447.3present3.33.2 4.78present 22 8/6/20054.21 507.1 2.82.17.13.859800072030 9/1/20055.16 10/1/20051.56 11/2/20053.04 12/9/20051.21 1/5/20061.11105367.2 1.11.67.24.591500 32 1/31/20061.18 Effluent Monitoring

29
VOC Monitoring Volatile Organic Compounds Volatile Organic Compounds Evaporate easily, aromatic Evaporate easily, aromatic Variable solubility in water, usually low Variable solubility in water, usually low Solvents, Thinners, Degreasers, Fuels Solvents, Thinners, Degreasers, Fuels Many petroleum derived or synthetic Many petroleum derived or synthetic Some Carcinogenic, Teratagenic Some Carcinogenic, Teratagenic Air pollution-smog Air pollution-smog Gas Chromatography Gas Chromatography Scan for 68 compounds Scan for 68 compounds Sample effluent only Sample effluent only RAW effluent RAW effluent Sand Filter Effluent Sand Filter Effluent Sample once per year in July Sample once per year in July Not Routinely Done in Sewage Plants Not Routinely Done in Sewage Plants Costly Test- $120 per sample, lab cost Costly Test- $120 per sample, lab cost

31
Compounds Found

32
Some Perspective Estimated Volume Estimated Volume System Volume-13,000 gallons System Volume-13,000 gallons 1300 parts per billion is 80 ml of acetone in 13,000 gallons. 1300 parts per billion is 80 ml of acetone in 13,000 gallons. 8 parts per billion is 0.5ml of p-isopropyltoluene in 13,000 gallons. 8 parts per billion is 0.5ml of p-isopropyltoluene in 13,000 gallons. Volumes probably more because of volatilization within the collection system. Volumes probably more because of volatilization within the collection system. Hit and Miss catching “slugs” of contaminants with limited sampling. Hit and Miss catching “slugs” of contaminants with limited sampling.

33
Piezometer Data Separation to Drainfield Trenches Separation to Drainfield Trenches Operation of System Operation of System

34
Bliss Separation 1987-1996

35
Bliss Separation 2001-2005

36
Site Evaluation Site Evaluation 1985 1985 Included analysis of Included analysis of Groundwater Elevation Groundwater Elevation Soil Conductivity Soil Conductivity Projected Mounding Projected Mounding

38
Example Soil Description

39
Conductivity Analysis

44
Groundwater Contours 1985

45
Estimated Groundwater Contours

49
Groundwater to Surface

50
Discussion/Questions???

Similar presentations


 Sewer – Sanitary waste Generated from buildings –Liquid discharged from plumbing fixtures Carried by sanitary.>")


 Zhengzhong Fang (John)>")