Download presentation
Presentation is loading. Please wait.

1
October 30 Do Now Q: Announcements: Important Dates: (that means…write it down in your calendar)
")
2
Use the following format for all your lab write ups! 1) Start with Investigative Question: Question based on observation that will be answered in the experiment. “What is the effect of (manipulated variable) on (responding variable)?” “What is the effect of different amounts of solutes inside the dialysis tubing, on mass of the tube after it has been sitting in solution for 30 minutes?
 Start with Investigative Question: Question based on observation that will be answered in the experiment. What is the effect of (manipulated variable) on (responding variable) What is the effect of different amounts of solutes inside the dialysis tubing, on mass of the tube after it has been sitting in solution for 30 minutes .")
3
2) Formulate a Hypothesis (prediction backed up by reasoning): You MUST back up your prediction with a logical reason. Write a thorough hypothesis by being very clear about the manipulated and responding variables. (Work with your lab partner to write a hypothesis for this investigation)
.")
4
3) Identify the variables: Manipulated (independent):The variable that is changed/ variable that investigator “manipulates” Responding (dependent):The variable that is measured due to the change Controlled variable: Other factors that are kept constant so that they cannot affect the responding variable (outcome). - materials and careful techniques are not controlled variables!

5
4) Identify the Groups: Experimental group- set-up that has the manipulated variable Control group- set-up without the manipulated variable TPS: WHY do we need these set-ups? Experimental Groups: -3 dialysis tubes with 10% sugar solution -3 dialysis tubes with 20% sugar solution -3 dialysis tubes with 30% sugar solution Control Group: -3 dialysis tubes with distilled water

6
5) Materials and Apparatus list: Bulleted list Includes quantities and size – Be as specific as possible (example: ‘50 mL beaker’ instead of ‘beaker’); include the volumes of tubes and cylinders, the concentrations of solutions, the model and manufacturer of any complex apparatus. If you have to decide how much of a substance or a solution to use, state your reasoning or show the calculations. Materials List: 12- 25cm strips of dialysis tubing 450mL of distilled water 50 mL of 10% sugar solution 50mL of 20% sugar solution 50mL of 30% sugar solution 1- funnel 4- 500mL beakers Electronic scale

7
6) Procedure:
 Procedure:")
8
Procedure (cont.) 1.Prepare a 10% sugar solution, 20% sugar solution, and 30% sugar solution using distilled water. The temperature of the water used to prepare each solution should be the same. 2.Soak all 12 strips of dialysis tubing (~20cm each) in water for 5 minutes to prep them for use. 3.Tie a knot at one end of three dialysis tubes 4.Using a funnel, fill the three dialysis tubes about 3/4 full with distilled water (control group). Each dialysis tube will serve as one trial. 5.Use a knot to tie off the open ends. Make sure that knot is tied tightly to prevent water from entering or leaving tube through the ends. 6.Repeat steps 3-5 using the 10% sugar solution, 20% sugar solution, and 30% sugar solution. 7.Thoroughly dry the outside of each dialysis tube and measure the mass of each tube. Record the mass (g) in data table. 8.Label 4-500 ml clean beakers as distilled, 10%, 20%, 30%. Fill them with distilled water to the 450 ml mark. Place the corresponding dialysis tubes in each of their appropriate beakers. 9.Let sit for 30 minutes. 10. Once 30 minutes are up, remove each tube from the beaker. 11. Thoroughly dry the outside of the dialysis tubes and measure the final mass (g) of each tube. 12.Record the mass in your data table.
 in water for 5 minutes to prep them for use. 3.Tie a knot at one end of three dialysis tubes 4.Using a funnel, fill the three dialysis tubes about 3/4 full with distilled water (control group). Each dialysis tube will serve as one trial. 5.Use a knot to tie off the open ends. Make sure that knot is tied tightly to prevent water from entering or leaving tube through the ends. 6.Repeat steps 3-5 using the 10% sugar solution, 20% sugar solution, and 30% sugar solution. 7.Thoroughly dry the outside of each dialysis tube and measure the mass of each tube. Record the mass (g) in data table. 8.Label ml clean beakers as distilled, 10%, 20%, 30%. Fill them with distilled water to the 450 ml mark. Place the corresponding dialysis tubes in each of their appropriate beakers. 9.Let sit for 30 minutes. 10. Once 30 minutes are up, remove each tube from the beaker. 11. Thoroughly dry the outside of the dialysis tubes and measure the final mass (g) of each tube. 12.Record the mass in your data table..")
9
7) Data Collection: Record data accurately and neatly May includes both qualitative and quantitative data Data table must include appropriate units in the headings, and a DESCRIPTIVE title Averages are included when trials are indicated
 Data Collection: Record data accurately and neatly May includes both qualitative and quantitative data Data table must include appropriate units in the headings, and a DESCRIPTIVE title Averages are included when trials are indicated")
10
8) Data Analysis: Process data in a meaningful way Include graphs and or mathematical calculations ex: calculations for taking an average Communicate patterns and trends
 Data Analysis: Process data in a meaningful way Include graphs and or mathematical calculations ex: calculations for taking an average Communicate patterns and trends")
11
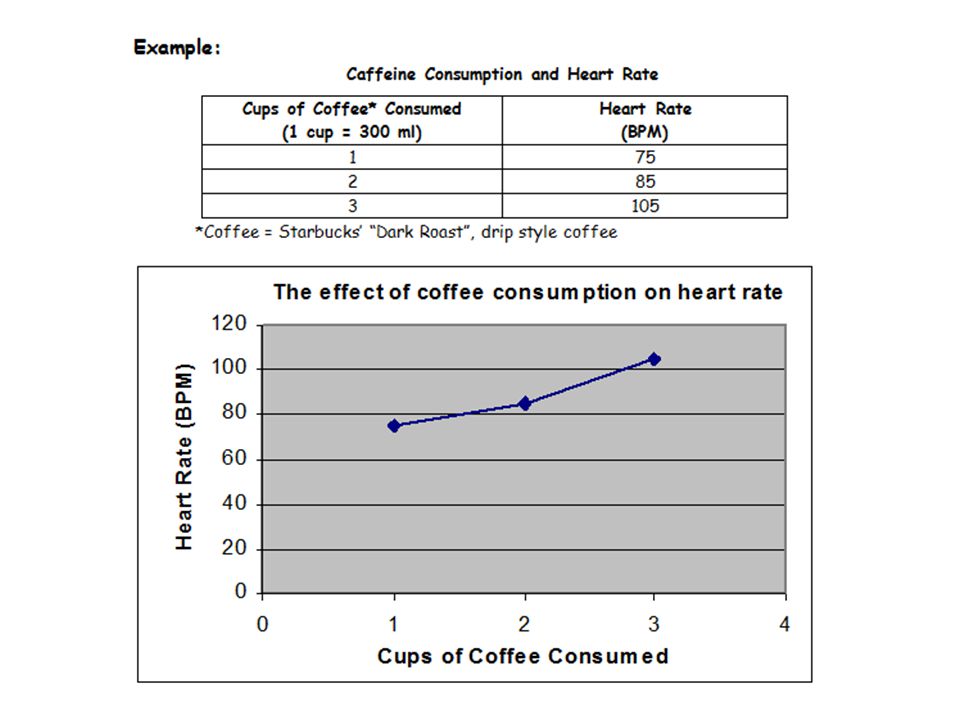
TITLE Describes what you are studying Y-AXIS Responding Variable & Unit of Measurement X-AXIS Manipulated Variable & Unit of Measurement KEY Identifies different sets of data found in your graph (should be color- coded) NEATNESS Ruler is used for lines on the graph Ruler is used for the X and Y axis lines Legible handwriting
 NEATNESS Ruler is used for lines on the graph Ruler is used for the X and Y axis lines Legible handwriting")
13
Copy the Data Table from Mr. Goodenough’s packet. Use this data for the Graph section following. Make a bar graph of the data.

14
9) Conclusion: 4 parts 1) State whether your hypothesis is “supported” or “not supported” 2) Evidence that your hypothesis is supported or not supported…. Use concrete data. Use range of data when available 3) Errors/improvements (realistic) 4) Modifications to the procedure Reminders: NO ABBREVIATIONS Include all the parts indicated in the directions Metric, metric, metric……
 Errors/improvements (realistic) 4) Modifications to the procedure Reminders: NO ABBREVIATIONS Include all the parts indicated in the directions Metric, metric, metric…….")
Similar presentations

 in any IB science course is based upon two kinds of assessments.>")

 is block justified. Title: Problem/Research.>")


