Download presentation
Presentation is loading. Please wait.

1
Bringing Order to the Web: Automatically Categorizing Search Results Hao Chen SIMS, UC Berkeley Susan Dumais Adaptive Systems & Interactions Microsoft Research

2
Find Information on the Web Search engine –E.g.: MSN, Altavista, Inktomi –Advantage: automatic, broad coverage –Disadvantage: mixed results due to ambiguous search terms Web directory –E.g.: looksmart, Yahoo! –Advantage: category labels provide context for browsing –Disadvantage: manual, narrow coverage

3
Automatically Categorizing Search Results Combine the advantage of –Broad coverage from search engine –Manually compiled web directory structure System component –Classifier Trained on manually classified web pages (offline) Classify search results on the fly –User Interface
 Classify search results on the fly –User Interface")
4
System Components SVM classified web pages model web search results classified Search results training (offline) running (online)
 running (online)")
5
Data Set Web directory from looksmart Categories –13 top level –150 second level –17173 in total Documents –450k total –370k unique –1.2 category / document on average

6
Text Pre-processing Text extraction –Title, keywords, image description text –Summary description field of meta tag, or first 40 words from the text Feature selection –Terms selected by mutual information –A feature vector is created for each document

7
Classification Support Vector Machine (SVM) Binary classification. Each document belongs to one or more categories Top level model was trained by 13352 documents Second level models was trained by between 2k – 10k documents Accuracy (break even point): 70% –Not ideal, but humans do not agree with each other more than 75-80% of the time
: 70% –Not ideal, but humans do not agree with each other more than 75-80% of the time.")
9
Information Overlay Green bars to represent percentage of documents in a category Hover text to provide parent – child context in category hierarchy Hover text to provide summary of web page

10
Distilled Information Display How many categories to present? –Only non empty top level categories at first –Users can expand any of them later How many documents to present in each category? –Proportional to its total number of documents

11
Distilled Information Display (Cont.) How to rank pages within each category? –Ranking score –Ranking order –Probability of classification How to rank categories? –Alphabetically –By number of documents –By average score

12
User Study

13
User Study Screen

14
Method Subjects –18 adults –Intermediate web ability and familiar with IE Procedure –Two sessions, 1 hour each –Subjects use Category interface in one session and List interface in the other one –15 search tasks in each session

15
Search Tasks Tasks: total=30 –Selected from sports, movies, travel, news,etc. –10 were from popular queries from MSNSearch –17 have answers from top 20 items –13 have answers from 21-100 th item –10 require ShowMore or SubCateg, 10 require scrolling To ensure comparability –Fix keywords for each query –Cache web search results

16
Experimental Design Counter balance: –The order each task is performed by a subject –The division of tasks into the Category interface and List interface –Which interface the subject uses first Within subject factor –Category vs. List interface Between subject factor –Which interface the subject uses first

17
Measures Subjective measures (Questionnaires) –Comparison between two interfaces –Rating of each interface and common features (hover text, category expansion, etc) –Web experiences Objective measures –Accuracy –Give up –Search time
 –Comparison between two interfaces –Rating of each interface and common features (hover text, category expansion, etc) –Web experiences Objective measures –Accuracy –Give up –Search time")
18
Subjective Results Category interface vs. List interface –Easy to use (6.4 vs. 3.9) –Confident that I could find information if it was there (6.3 vs. 4.4) –Easy to get a good sense of the range of alternatives (6.4 vs. 4.2) –Prefer this to my usual search engine (6.4 vs. 4.3) No reliable difference about usefulness of interface features (hover text, expansion)
 –Confident that I could find information if it was there (6.3 vs. 4.4) –Easy to get a good sense of the range of alternatives (6.4 vs. 4.2) –Prefer this to my usual search engine (6.4 vs. 4.3) No reliable difference about usefulness of interface features (hover text, expansion).")
19
Accuracy Liberal scoring Strict scoring –Category interface: 1.06 wrong out of 30 –List interface: 1.72 wrong out of 30 –Not statistically significant (p<0.13) –Reflects difference in criterion, not difficulty of tasks
 –Reflects difference in criterion, not difficulty of tasks")
20
Give Up Category Interface: 0.33 out of 30 List Interface: 0.77 out of 30 Significant (p<0.027) But both are small
 But both are small")
22
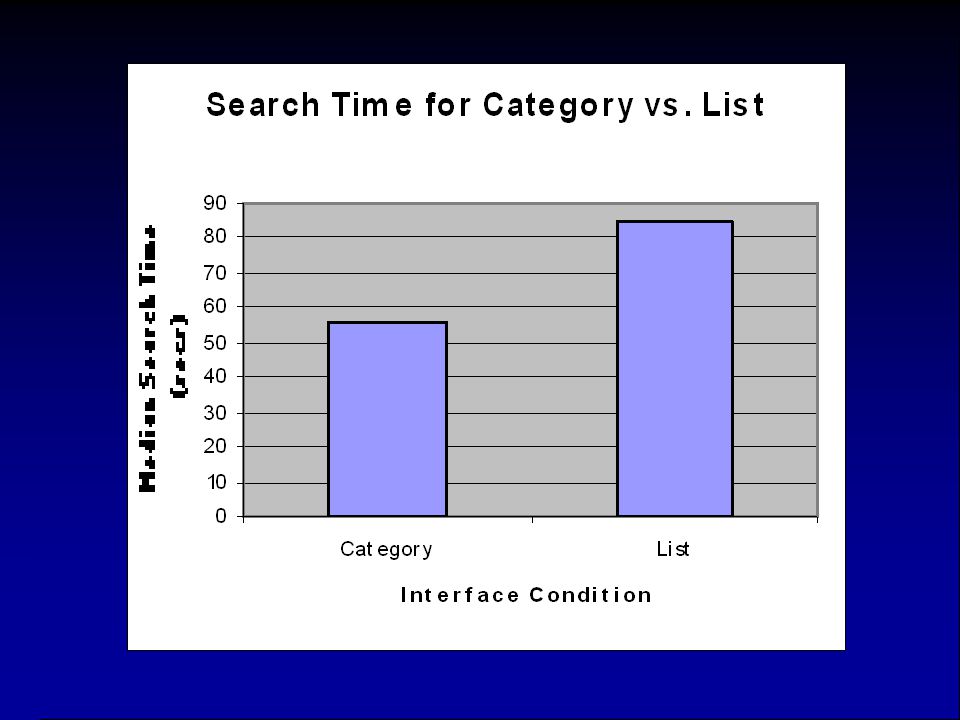
Search Time Factors: –Within subject: List vs. Category interface –Between subject: List first vs. Category first Median search time –Category interface: 56 seconds –List Interface: 85 seconds –Significant (F(1,16) = 12.94; p=0.002) No effect of which interface is shown first No interaction between task order and interface
 = 12.94; p=0.002) No effect of which interface is shown first No interaction between task order and interface.")
24
Search Time by Query Difficulty Median search time –Top 20: 57 seconds –Not Top 20: 98 seconds Category interface is beneficial in both easy and difficult tasks No interaction between query difficulty and interface –F(1,56)=2.52; p=0.12
=2.52; p=0.12")
25
Hover Text and Browsing Hover per task –Category: 2.99List: 4.60 Browse per task –Category: 1.23List: 1.41 Category structure help disambiguate the summary Users can usually narrow down their search by reading just the summary Hover text reduces user’s response time –Short –No network delay

26
Expansion ShowMore and/or SubCateg –Category interface: 0.78 –List interface: 0.48 –Significant (p<0.003) Although the user do more expansion in Category interface, they are more efficient overall because the selective feature.
 Although the user do more expansion in Category interface, they are more efficient overall because the selective feature.")
27
Conclusion Text classification –Support Vector Machine –Trained on web directory (looksmart) User Interface –Documents presented in category structure –Operations on the category structure –Interaction style, distilled information display User Study –Convincingly demonstrated the advantage of the Category interface
 User Interface –Documents presented in category structure –Operations on the category structure –Interaction style, distilled information display User Study –Convincingly demonstrated the advantage of the Category interface")
28
Further Work New document representation and machine learning algorithms Explore presentation that best represent both context and individual search result How to order categories? How many documents to present in each category? Automatic expand big categories? Use other information, e.g. frequency of use, authoritativeness, recommendations

Similar presentations


>")


