Download presentation
Presentation is loading. Please wait.

1
Tom Walsh Economist, Office of Economic Advisors Department of Workforce Development November 15, 2013 Labor Market Trends and Labor Market Outlook WTCS Student Employment Services Coordinators

2
Statewide LMI Examining Regional Economies Projections and Outlook Skill Explorer Demo Contents

3
Job Base – U.S.

4
Job Base– U.S. and Wisconsin Source: Bureau of Labor Statics, Current Employment Statistics Total Monthly Job Base Relative to December 2007

5
Job Base– Wisconsin and Neighboring States Source: Bureau of Labor Statics, Current Employment Statistics Total Monthly Job Base Relative to December 2007

6
Unemployment Rates – Wisconsin and US Source: Bureau of Labor Statics, LAUS and CPS

7
Industry Employment Change

8
1.0% 1.7%

9
Industry Employment Change

11
Initial Claims for Unemployment Insurance Annual Initial Claims - Statewide Source: Department of Workforce Development, Unemployment Insurance Statistics

12
20122013% Change YTD478,578438,530-8.4% Week 45 (4-Week Average)11,2789,521-15.6% Initial Claims for Unemployment Insurance Initial Claims - Statewide Source: Department of Workforce Development, Unemployment Insurance Statistics
11,2789, % Initial Claims for Unemployment Insurance Initial Claims - Statewide Source: Department of Workforce Development, Unemployment Insurance Statistics")
13
20122013Change% Change AGRI FORESTRY FISH HUNT598416-182-30.4% MINING10148-53-52.5% UTILITIES3728-9-24.3% CONSTRUCTION7,4644,639-2,825-37.8% MANUFACTURING12,0757,041-5,034-41.7% WHOLESALE TRADE1,148929-219-19.1% RETAIL TRADE3,0962,087-1,009-32.6% TRANS AND WAREHOUSING1,9561,102-854-43.7% INFORMATION284196-88-31.0% FINANCE AND INS534406-128-24.0% REAL ESTATE AND RENTAL LEASING382223-159-41.6% PRO SCI AND TECH SERV979672-307-31.4% MGMT OF CO AND ENTERPRISES14115096.4% ADMIN SUPP WASTE MGT REMED SERVS5,8793,743-2,136-36.3% EDUCATIONAL SERVICES596258-338-56.7% HEALTH CARE AND SOCIAL ASST2,7251,888-837-30.7% ARTS ENT AND REC1,5411,066-475-30.8% ACCOMMODATION AND FOOD SERV3,4682,328-1,140-32.9% OTHER SERV EXCEPT PUBLIC ADMIN930600-330-35.5% PUBLIC ADMIN937664-273-29.1% INFO NOT AVAIL242266249.9% Initial Claims for Unemployment Insurance Initial UI Claims by Industry - Week 42 through Week 45 Source: Department of Workforce Development, Unemployment Insurance Statistics

14
20122013Change% Change Total15,87319,9924,11926% AGRI FORESTRY FISH HUNT4134-7-17% MINING103-7-70% UTILITIES868933% CONSTRUCTION36455118751% MANUFACTURING1,7102,40169140% WHOLESALE TRADE39963423559% RETAIL TRADE1,6941,444-250-15% TRANS AND WAREHOUSING63079916927% INFORMATION18229511362% FINANCE AND INS52671919337% REAL ESTATE AND RENTAL LEASING65892437% PRO SCI AND TECH SERV7081,31861086% MGMT OF CO AND ENTERPRISES802698-104-13% ADMIN SUPP WASTE MGT REMED SERVS4,0315,1751,14428% EDUCATIONAL SERVICES24440115764% HEALTH CARE AND SOCIAL ASST2,4223,25783534% ARTS ENT AND REC1882152714% ACCOMMODATION AND FOOD SERV7518439212% OTHER SERV EXCEPT PUBLIC ADMIN4194876816% PUBLIC ADMIN426450246% Internal Job Postings by Industry: Week 42 through Week 45 Internal Job Postings Source: Department of Workforce Development, Internal Job Postings

15
INDUSTRYINITIAL CLAIMSJOB POSTINGS TOTAL AGRI FORESTRY FISH HUNT-- MINING-- UTILITIES-- CONSTRUCTION MANUFACTURING WHOLESALE TRADE RETAIL TRADE TRANS AND WAREHOUSING INFORMATION FINANCE AND INS REAL ESTATE AND RENTAL LEASING PRO SCI AND TECH SERV MGMT OF CO AND ENTERPRISES ADMIN SUPP WASTE MGT REMED SERVS EDUCATIONAL SERVICES HEALTH CARE AND SOCIAL ASST ARTS ENT AND REC ACCOMMODATION AND FOOD SERV OTHER SERV EXCEPT PUBLIC ADMIN PUBLIC ADMIN Initial UI Claims and Internal Job Postings

16
Steady/slow employment growth Similar trajectory Initial UI claims declining Job Postings increasing Summary

17
Examining Regional Economies

18
Regional Employment Change Indexed Employment by WDA (12/2007 = 1) Source: U.S. Census Bureau X-12-ARIMA Seasonal Adjustment Program, U.S. BLS QCEW

19
Demographics Industry Composition Industry Subsector Change Employment Statistics UI Claims Regional Indicators

20
Industry Composition Share of Total Covered Employment Source: WI WORKnet, QCEW

21
Industry Composition Source: U.S Census Bureau, 2012 Q3 QWI

22
Industry Composition Source: U.S. BLS, QCEW 2011-2012 Employment Change: Tri-County

23
Employment Statistics

24
OEA County Profiles OEA WDA Data Briefs DWD UI Stats American Factfinder On the Map Helpful Resources

25
Projections and Outlook

26
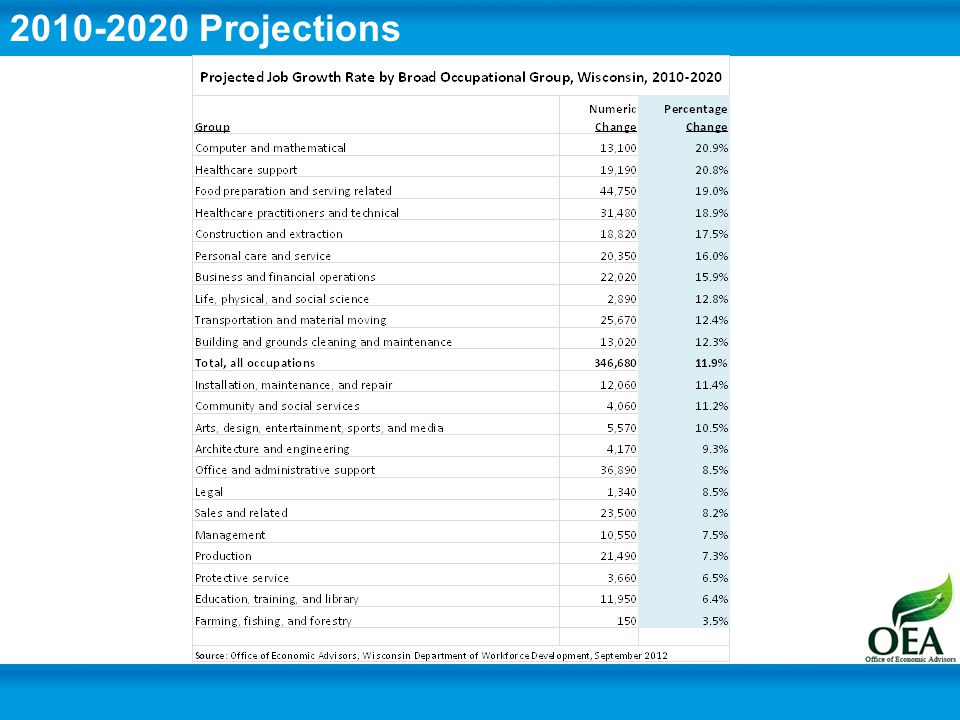
2010-2020 Projections

28
Source: WI OEA, Long-term Employment Projections 2010-2020 2010-2020 Projections

29
Source: WI OEA, Long-term Employment Projections 2010-2020 2010-2020 Projections

31
Outlook

32
Source: U.S Census Bureau, DWD LAUS, WI OEA

33
Outlook

36
skillexplorer.wisconsin.gov/ Skill Explorer

37
Contact Information The Wisconsin Department of Workforce Development’s Office of Economic Advisors (OEA) is charged with assisting all interested parties in better understanding their local economies. OEA has labor economists positioned throughout Wisconsin to help those involved in economic and workforce Development. For more information about this region please contact: Tom Walsh Regional Economist—North Central Wisconsin 715.261.8747 Thomas.Walsh@dwd.wisconsin.gov

Similar presentations


 2004 - 2009 ImprovingLeading LaggingSlipping Source: Oklahoma.>")


739-4206 - L. Jay Burks What is a NAICS Code The North American Industry Classification System (NAICS)>")

>")


 Industry Employment Projection Report: 2010-2020 EmploymentProjected Change.>")
 Webinar # 2 of 4 February 12 th, 2014 Andrew W. Hait.>")
 Industry Employment Projection Report: 2010-2020 EmploymentProjected Change NAICS.>")