Download presentation
Presentation is loading. Please wait.

1
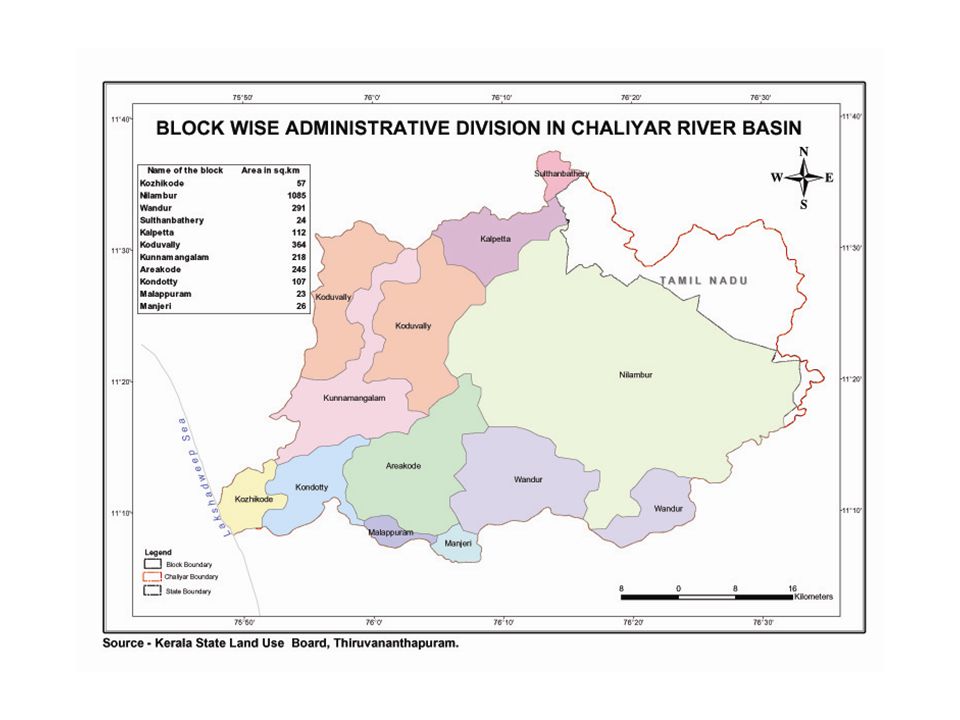
INTEGRATED RIVER BASIN MANAGEMENT IN WESTERN GHAT REGION THROUGH A CASE STUDY Dr A B Anitha Scientist F & Head Surface Water Division Centre for Water Resources Development and Management Kozhikode,Kerala September 2014

2
Need for an Integrated River Basin Management No interdepartmental cooperation among the user Departments Downstream users are not aware of the upstream interventions Integrated River Basin Management should consider multiple water uses in a river basin Coordination with other sectors and levels of government –(nation planning, regional planning) Will help the planners and decision makers in solving water management issues
 Will help the planners and decision makers in solving water management issues")
3
Database Survey of India Toposheets Rainfall and Runoff data from IMD, CWC WRD, KSEB IRS data for landuse classification Present utilization and future demand of water from KWA, WRD, KSEB, KSPCB and Dept. of Industries Block wise groundwater data from CGWB Modern tools like GIS, GPS and Remote Sensing Techniques were used

4
Hydrological Analysis Done Spatial and temporal water availability and demand Water quality status Present water resources utilization Future water resources demand Spatial water balance Surplus/deficit Management strategies

6
location details of raingauge stations.docx Mean monthly rainfall.docx Spatial and Temporal Distribution of Rainfall

8
Isohyetal map of Chaliyar Annual rainfall varies from 2130-4625 mm

9
Location details of river gauging stations.docx Spatial and Temporal Analysis of Runoff

11
Mean monthly Surface Water Availability (MCM) in Chaliyar River Basin Station Area, Sq.km JunJulAugSepOctNovDecJanFebMarAprMayTotal Kuniyil 18766261262.9952.6503.1420.6240.873.938.412.79.3743.64190.9 Koodathai 11776.1154.911952.349.535.315.46.63.72.92.88.3526.8 Mukkom 206.3189.8354.2250.298.48047.215.87.73.73.44.414.51069.3 Total 2199.3891.917721321.8653.8550.1323.3105.152.720.115.614.266.45787 Ungauged area 723.7241.5162.682.522.15.00.60.0 514.4 Total Catchment area 29231133.41934.61404.3675.9555.1323.9105.152.720.115.614.266.46301.4 T N Area 3889.413.222.735.198.8124.943.36.52.414.98.122.7 402 Kerala 25351124.01921.41381.6640.8456.3199.061.846.217.70.76.143.75899.4 Total Surface Water Availability in Kerala 5899 MCM
 in Chaliyar River Basin Station Area, Sq.km JunJulAugSepOctNovDecJanFebMarAprMayTotal Kuniyil Koodathai Mukkom Total Ungauged area Total Catchment area T N Area Kerala Total Surface Water Availability in Kerala 5899 MCM")
12
Utilizable Yield (MCM) of Chaliyar river Basin Station Area, Sq.km JunJulAugSepOctNovDecJanFebMarAprMayTotal Kuniyil 1876.0626.01262.9952.6503.1420.6240.873.938.412.79.37.043.64190.9 Highland 1313.2372.5751.4566.8299.3250.3143.344.022.87.65.54.225.92493.6 Midland 562.8126.8255.7192.9101.985.248.815.07.82.61.91.48.8848.7 Total499.21007.2759.7401.2335.4192.058.930.610.17.45.634.83342.2 Koodathai 117.076.1154.9119.052.349.535.315.46.63.72.92.88.3526.8 Highland 46.825.952.740.517.816.812.05.22.21.31.0 2.8179.1 Midland 70.225.151.139.317.316.311.65.12.21.21.00.92.7173.8 Total51.0103.879.735.033.223.710.34.42.51.9 5.6353.0 Mukkom 206.3189.8354.2250.298.480.047.215.87.73.73.44.414.51069.3 Highland 140.4109.8204.9144.856.946.327.39.14.52.12.02.58.4618.7 Midland 66.140.074.652.720.716.99.93.31.60.80.70.93.1225.3 Total149.8279.6197.577.763.137.312.56.12.92.73.511.4844.0 Total Catchment 2199.3700.01390.51036.9513.9431.7252.981.741.115.512.010.951.84539.2 Runoff in T N Area388.09.413.222.735.198.8124.943.36.52.414.98.122.7 402.0 Utilizable yield in Kerala 690.61377.31014.2478.8332.9128.038.434.613.1-2.92.829.14137.2 Monsoon yield 4021.9 Non monsoon yield 115.2
 of Chaliyar river Basin Station Area, Sq.km JunJulAugSepOctNovDecJanFebMarAprMayTotal Kuniyil Highland Midland Total Koodathai Highland Midland Total Mukkom Highland Midland Total Total Catchment Runoff in T N Area Utilizable yield in Kerala Monsoon yield Non monsoon yield 115.2")
13
Month Depend ability Maruth apuzha Punnap uzha Karim puzha Chaliy ar Kanchirap uzha Kuthirap uzha Areaco de Mukko m Kooda thai Kuniyi l Dec50%7.118.726.217.13.78.46415.81465.5 75%514.316.68.72.56.3318.8745.6 90%49.294.70.73.98.73.94.30 Jan50%410119.125.1337429.3 75%2.54.914.70.6319.13.703.6 90%12.801.100.95.50.200 Feb50%2.24.2 5.512.1182211.1 75%1.71.403.10.217.30.900 90%0000001.9000 Mar50%2.23.21.55.10.21.21421.64.7 75%0.9000005.2000 90%000 001.1000 Apr50%2.23.91.14.30.21.8122.1 2.6 75%10.500.7002.5000 90%0000000.5 00 May50%35.98.16.716.3209412.3 75%22.42203.27.4200 90%00.60 002.70.600 50%, 75% and 90% dependable flows of sub basins of Chaliyar

14
Flow Duration Curves

15
GROUNDWATER RESOURCES OF CHALIYAR Groundwater resources of Chaliyar.docx

18
Water Availability Surface Water Monsoon flow: 5723 MCM Non monsoon: 176 MCM Utilizable flow Monsoon flow: 4022 M MCM Non monsoon: 115 MCM Groundwater Potential:283.25 MCM GW Draft : 140 MCM 4 blocks semi critical ; 8 Blocks safe

19
Water Quality Status Higher level of dissolved solids in coastal region 75% of wells show significant level of nitrate bore wells having high iron Except for pH, all the quality variables comply with the desirable limit The spatial trends of chloride, sulphate, sodium and calcium Low concentrations of these constituents confirming the good quality of water except few wells in the coastal area.

21
STATUS OF WATER RESOURCES UTILIZATION AND FUTURE DEMAND FOR VARIOUS PURPOSES

22
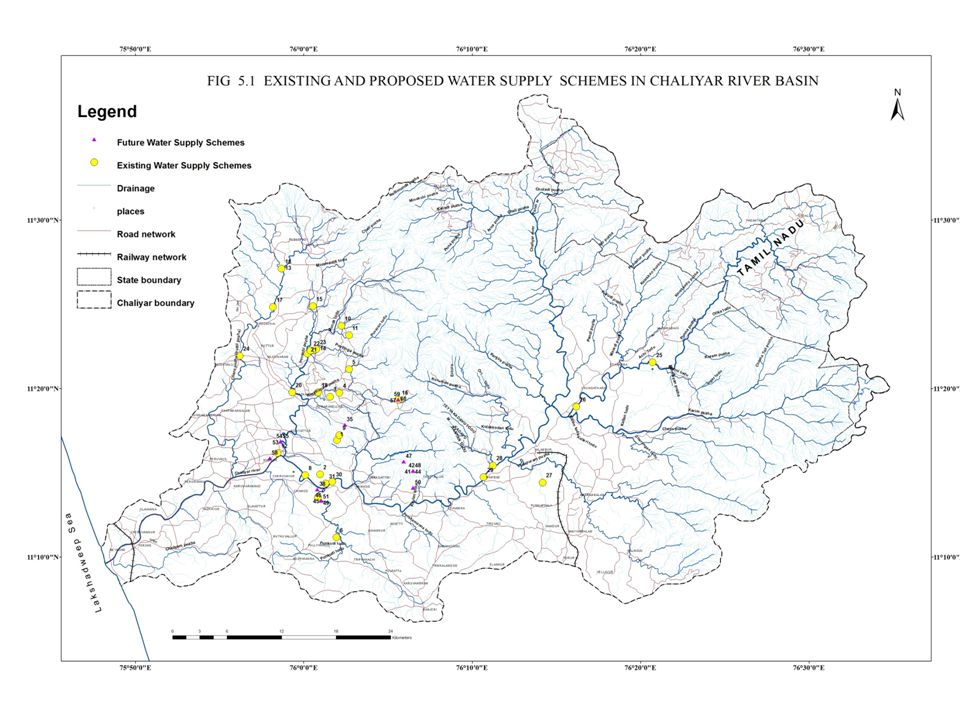
Water for Domestic Purpose Present Utilization – No. of Schemes: 42 Schemes in Kozhikode & Malappuram Districts - Water utilization - 218 MLD 80 MCM Future Demand No. of new Schemes – 45 Water utilization - 409 MLD 150 MCM

24
Water for Irrigation No major schemes One medium scheme for salinity arresting – 4 Diversion Schemes – 24 Lift Irrigation Schemes – 30 Vented Cross Bars – 4 Ongoing medium schemes Net irrigated area - 15,423 ha Proposed schemes - 6 major,5 medium and many check dams Net area to be irrigated – 20,368 ha

25
Topographical View of Regulator cum Bridge at Kavanakkallu Upstream view of Kavanakkallu Regulator- cum Bridge EXISTING WATER RESOURCES STRUCTURES

27
Hydel Power Generation Present Utilisation 4 small hydro electric schemes in Chaliyar river basin which produces 16.6 MW power making use of 308 MCM of water. Four schemes are under construction which can produce 17.7 MW power making use of 183 MCM of water Future Schemes - 3 major schemes -12 small hydel schemes - 15 small shcemes under feasibility stage Power generation – 342 MW, 932.13 MU, 1437 MCM

29
Water for other purposes INDUSTRIAL WATER REQUIREMENT-12.35 MCM WATER FOR SALINITY EXCLUSION-184MCM INLAND NAVIGATION 39 Km length ECOLOGICAL BALANCE 10-15 % of Annual flow 17 MCM during non monsoon months

30
SeasonUtilizable potential, MCM Present utilizati on, MCM Surplus /Deficit MCM Future Demand MCM Surplus/Deficit MCM Surface Ground Total Monsoon 4022 56407846.5Surplus87Surplus Non monsoon 115 84199332.5Deficit (-133.5) 413Deficit (-214) Water Balance
 413Deficit (-214) Water Balance")
31
CONCLUSIONS Chaliyar basin is at present deficit by 133.5 MCM of water during non monsoon period and will have a deficit of fresh water of 214 MCM by 2040 AD For successful planning, implementation and management of a river basin,there should be an organization at the basin level for all developmental activities related to water resources irrespective of administrative boundaries Few more projects are needed for the sustainable development of the river basin.

32
Thank you

Similar presentations


 and ISET Team Shashikant Chopde, Sarah-Opitz Stapleton, Marcus Moench.>")


