Download presentation
Presentation is loading. Please wait.

1
lhsc.lsu.edu 2006 Traffic Records Data Report Presented by Dr. Helmut Schneider November 11, 2007

2
Overview 1 The Cost of Crashes 2 Key Issues 3 Progress and Exposure 4

3
889 fatal crashes 985 killed (+2.1%) 48,682 injury traffic crashes with 79,976 injuries (+3.5%) 112,299 property-damage-only crashes (+3.9%) Crash Overview Changes 2005-2006 in parenthesis
 48,682 injury traffic crashes with 79,976 injuries (+3.5%) 112,299 property-damage-only crashes (+3.9%) Crash Overview Changes in parenthesis")
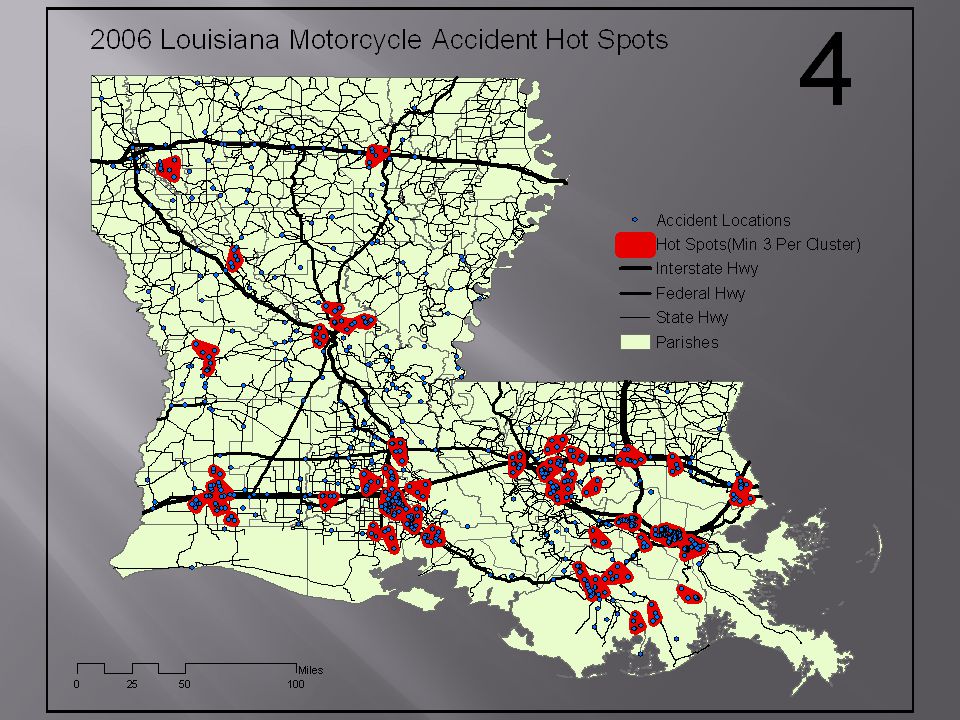
4
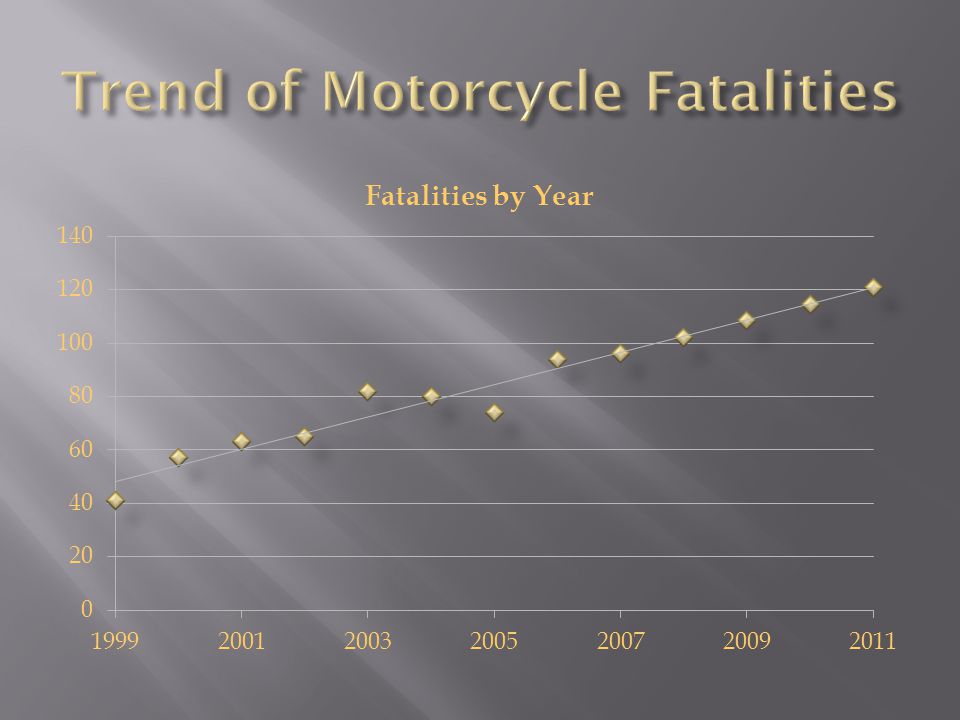
99 were killed as pedestrians which decreased by 8.3% from 2005. 687 were killed as drivers of vehicles which increased by 5.9% from 2005. 94 were killed on motorcycles which increased by 27% from 2005. 23 were killed on bicycles which increased by 4.5% from 2005.

5
Louisiana's 2006 mileage fatality rate was 2.17 per 100 million miles traveled, increased by 1.06% from 2005. Louisiana's 2006 fatality rate was 22.44 per 100,000 population which increased by 2.07% from 2005. Louisiana's 2006 fatality rate was 34.33 per 100,000 licensed drivers which increased by 1% from 2005. Louisiana’s goal for mileage fatality rates in 2010 is 1.5.

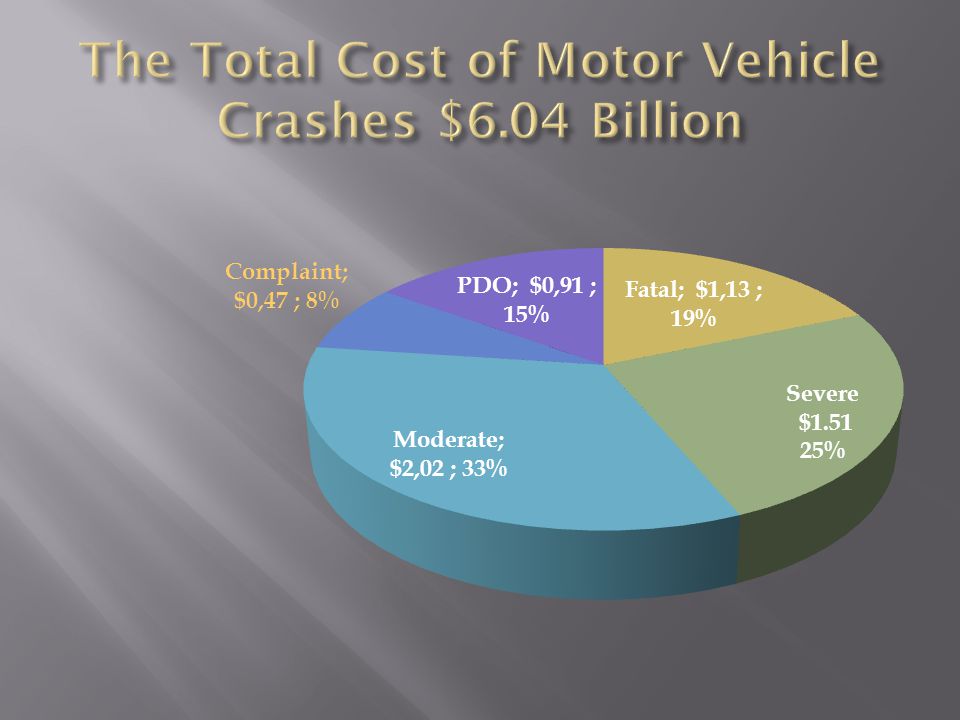
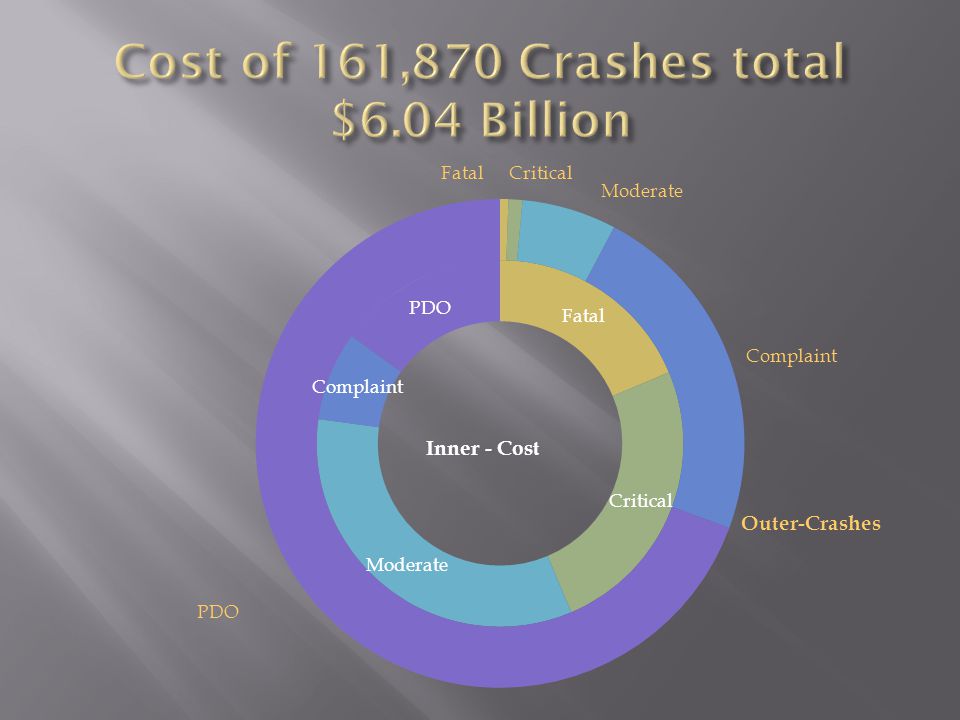
6
$6.03 billion dollars for the citizens of Louisiana This accounts for about 4.5% of personal income $2,104 for every licensed driver in Louisiana (based on 2.869 million licensed drivers Source: Cost estimates are based on a study conducted by NHTSA in 2000 “The Economic Impact of Motor Vehicle Crashes” (DOT HS 809446).
.")
10
80% of the problems come from 20% of the causes Separate the Vital Few from the Trivial Many Vilfredo Pareto, 1848-1923

11
Lack of Seatbelt Use Aggressive Driving Alcohol 62% 48% 51% Includes only cars, PKUP and vans

13
Believes “people should be free to choose if they want to wear a seat belt or not” 38% “seat belts are uncomfortabl e” 46% Behavior 25% do not wear a seat belt Injuries 60% of drivers killed did not wear a seat belt Chance of death in rollover crash 2% (w) versus 20% (w/o)
 versus 20% (w/o)")
14
PerceptionsSTRONGLY AGREE SOME AGREE SOME DISAGREE STRONGLY DISAGREE DNK Seat belts are not needed on short trips 2.32.59.085.50.8 Seat belts are just as likely to harm you as to help you 6.516.516.856.83.5 Seat belts are uncomfortable16.028.816.338.50.5 People should be free to choose if they want to wear a seat belt or not 19.818.510.050.31.5 Seat belts aren't needed when in a pickup truck because it is a safer vehicle due to its sheer size 2.03.510.581.03.0

17
While 25% of occupants do not wear a seatbelts, they make up 62% of killed occupants.

20
$1.15 Billion in 2006 $403 for every licensed driver Including pain and suffering $2.9 Billion in 2006 $1,022 for every licensed driver

21
Year Fatalities (LA) Fatalitie s per 100 Million Miles Traveled Percent Fatalitie s (LA) Alcohol- Related Injury Crashes (1,000) Percent Alcohol- Related Injury Crashes Alcohol- Related PDO Crashes (1,000) Percent Alcohol- Related PDO Crashes Alcohol- Related Crashes (1,000) Percent Alcohol- Related Crashes 20004461.1048%4.38.9%43.7%8.75.5% 20014461.0847%5.210.7%5.55.1%117.0% 20024311.0047%5.410.6%6.85.9%137.5% 20034140.9444%4.910.0%6.45.7%127.2% 20044511.0145%4.79.3%6.15.4%116.8% 20054040.9042%4.38.7%4.54.1%95.8% 20064551.0046%4.48.9%4.54.0%9.05.7% Difference 1 Year12.6%10.3%4.3%1.3%0.3%-0.3%-0.2%0.9%-0.1% 5 Year2.0%-7.5%-0.9%-16.5%-1.8%-19.4%-1.1%-17.3%-1.3%
 Fatalitie s per 100 Million Miles Traveled Percent Fatalitie s (LA) Alcohol- Related Injury Crashes (1,000) Percent Alcohol- Related Injury Crashes Alcohol- Related PDO Crashes (1,000) Percent Alcohol- Related PDO Crashes Alcohol- Related Crashes (1,000) Percent Alcohol- Related Crashes %4.38.9%43.7%8.75.5% % %5.55.1%117.0% % %6.85.9%137.5% % %6.45.7%127.2% %4.79.3%6.15.4%116.8% %4.38.7%4.54.1%95.8% %4.48.9%4.54.0%9.05.7% Difference 1 Year12.6%10.3%4.3%1.3%0.3%-0.3%-0.2%0.9%-0.1% 5 Year2.0%-7.5%-0.9%-16.5%-1.8%-19.4%-1.1%-17.3%-1.3%")
22
Submits and RefusalsPercentage Year Submit 1 Submit 2+ Refusal 1 Refusal 2+Refusal Convictions DWI 1st-4th894 % No Convictions 2000 14,860 2,638 6,190 1,23730%34%17%48% 2001 13,768 2,203 6,131 1,22232%34%19%47% 2002 12,446 1,845 6,136 1,18834%29%15%56% 2003 11,070 1,597 5,582 1,05734%32%19%49% 2004 11,383 1,381 5,210 1,03533%29%17%54% 2005 9,616 1,121 5,439 88332%26%17%57% 2006 10,273 1,009 5,462 91036%20%14%66% Years Diff 17%-10%0%3%4%-6%-3%9% 5-25%-54%-11%-26%4%-14%-5%19% According to Bob Thompson this data may be unreliable because of reporting issues.

23
YearAlcohol Involved Ages 15 - 17Ages 18 - 20Ages 21 - 24 FatalInjuryFatalInjuryFatalInjury 1999121022428025276 2000121222829827308 2001213033555936603 2002192773457231582 2003162803150735534 2004241982947539521 2005263013345034441 2006201773644538468 Difference 1 Year-22%-41%9%-1%10%6% 5 Year-3%-41%3%-20%4%-22%

24
Drivers using AlcoholCrashes per Percentage of all Drivers % alc- related Age ofFatal CrashesInjury 100,000 Licensed Drivers Fatal Crashes DriverAll Dr Killed Dr.Crsh.AllKilledInjuryLic. Dr.All Dr Killed Dr. 15-179467125903%2%1%22% 18-20442741530182795%11%9%33% 21-24665075730233438%16% 44% 25-34118861,235241724917%29%28%37% 35-448473924161417419%20%24%32% 45-54564263910711320%14% 25% 55-642218206544915%5%6%18% 65-74835331228%2%1%16% 75-8444123395%1% 13% 85-941124471%0% 11% 95&up001001580% ALL4143094,3361411152100% 30%

25
Parishes Regions Time of day & day of week GIS Maps

26
1000 # Alc-Rltd Fatal# Alc-Rltd Injury Licens ed Alcohol- Related Crashes per 100,000 Lc. Drvs. ParishDriversFtl CrshInj CrshRank Parishes with more than 100,000 Licensed Drivers JEFFERSON2952627096927 EAST BATON ROUGE256263691051444 ORLEANS20711230571116 ST TAMMANY158172011141275 CADDO153212991431952 LAFAYETTE139222241621613 CALCASIEU129252781912161 DRIVERS AVERAGE19121267110140

27
www.themegallery.comCompany Logo

28
Alcohol Crashes in Lafayette

31
We all know it when we see it. Defining it in operational terms is difficult. How would it be applied? “Careless Operation” seems to be a “catch all” for speeding and other aggressive driving already.

32
Cell Phone - 10 Other electronic Devices - 2 Other inside - 19 Other outside - 29

33
2282 (2125) crashes 1247 (1325) injured 10 (7) killed
 crashes 1247 (1325) injured 10 (7) killed")
34
Urban 30 min. Rural 50 min.

35
This analysis only considers motorcycles with two wheels on public roads. Dirt bikes on public roads are included, but no ATVs. Only 2-wheel motorcycles or 3-wheel motorcycle with side compartment Including 2-wheel off-road vehicles on public roads Excluding all 4-wheel or 3-wheel off road vehicles

36
Motorcycles, motor driven cycles, and motorized bicycles are not be given a separate class, as such, but their use shall be provided for by making an endorsement. Such an endorsement shall be made only after the applicant has taken and successfully passed tests specifically designed for the operation of such vehicles. To comply with this law, the operator of any motorcycle, motor driven cycle or motorized bicycle (moped), in excess of 5 horsepower, regardless of maximum speed, or size of motor, must have an "M" endorsement on one of the basic classes of operator's license to operate such vehicle on the streets, highways, or roadways in Louisiana.
, in excess of 5 horsepower, regardless of maximum speed, or size of motor, must have an M endorsement on one of the basic classes of operator s license to operate such vehicle on the streets, highways, or roadways in Louisiana..")
42
A cost of $1.7 Billion to the Citizens of Louisiana in the past 5 years

44
ModelNumber of Fatal Drivers Predicted 200687 0% helmet use136 50% helmet use108 100% helmet use80 Actual 2006 (88% helmet use) 89
 89")
47
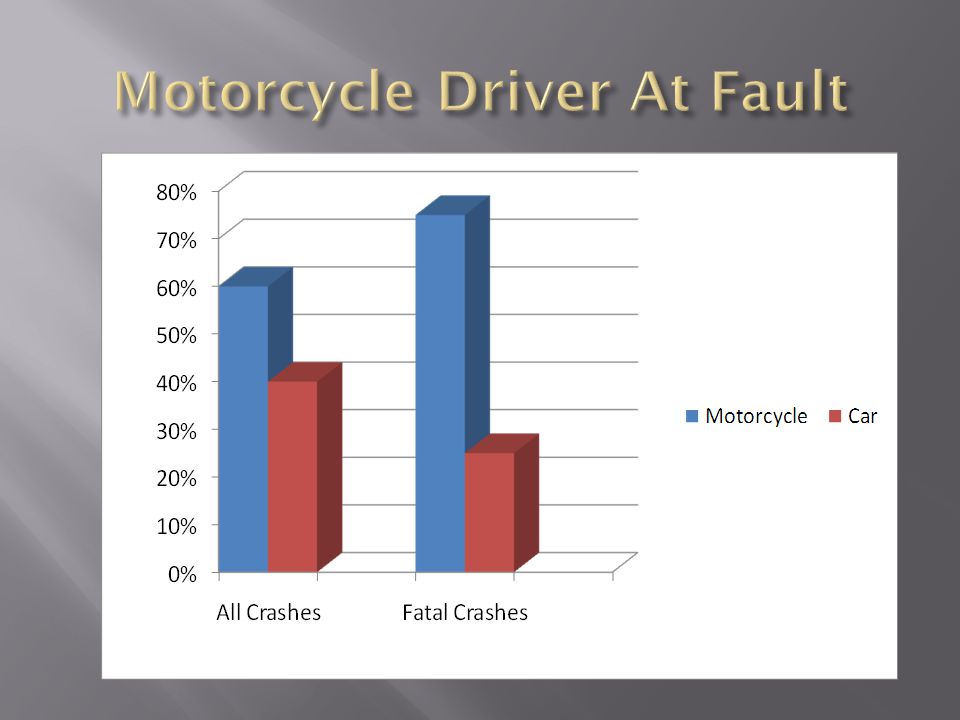
Number VehiclesMotorcycle at Fault Single100% Multiple43% All71%

48
Only 36% of motorcycle riders in crashes had an endorsement What does that mean? Did the other 64% Never have an endorsement? Had an endorsement not renewed?

50
No Helmet Used Difference FATAL 6.5%3.9%2.5% INCAPACITATING/SEVERE 10.5%7.3%3.3% NON-INCAPACITATING/MODERATE 40%37.7%2.3% COMPLAINT 32%36.0%-4.4% NONE 11%15.1%-3.6%

51
MakeAllFatal HARLEY DAVIDSON 11%27% HONDA 8%33% KAWASAKI 7%47% SUZUKI 7%25% YAMAHA 10%54%

53
The risk of fatal injuries in crashes doubles when motorcycle riders do not wear a helmet (6.5% versus 3.9%). The risk of critical injury in a crash increases when motorcycle riders do not wear a helmet (10.5% versus 7.3%). However, alcohol is a much larger contributing factor to the death rate than wearing a helmet (18.7% versus 3.2%). Over the next 5 years helmet use could save $730 million for Louisiana citizens.
. However, alcohol is a much larger contributing factor to the death rate than wearing a helmet (18.7% versus 3.2%). Over the next 5 years helmet use could save $730 million for Louisiana citizens..")
54
PROGRESS IN SAFETYINCREASE IN EXPOSURE Increase in set belt use from 2000 to 2006 Some progress with reducing alcohol related crashes for minors Other non measureable progress Public awareness Road safety Increase in vehicle miles driven Increase in SUVs Increase in motorcycles on roads

55
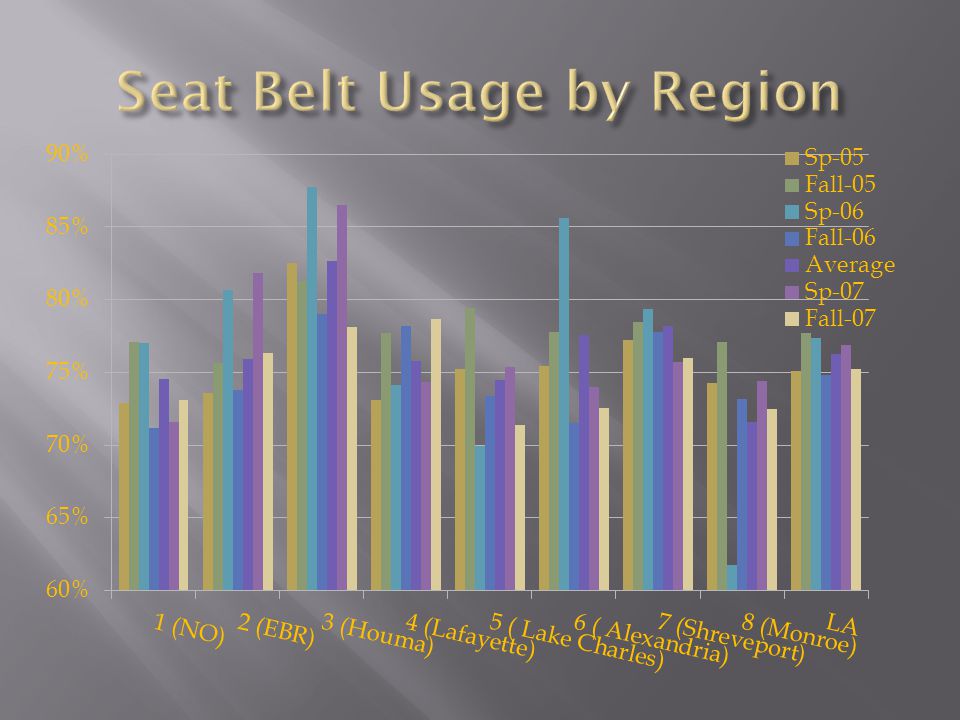
None usedUsed All Year%KilledTotal%KilledTotalAllKilled% Killed % Seat Belt Usage 200015%725000.3%614213041862.8%74.0% 200112%635080.5%1014122944792.7%73.5% 200211%595140.7%1014973229742.3%74.4% Average13%655070.6%914433071802.6%74% 200319%914780.8%14168632751123.4%77.9% 200416%724590.5%1122623670862.3%83.1% 200516%865270.7%20267536141153.2%83.5% 200616%1036581.2%32272337091353.6%80.5% Average17%885310.8%19233735671123.1%81.5%

56
Google maps Google maps Google Earth

Similar presentations


 Population Motor vehicles.>")
![Graduated Driver Licensing: Is it effective?. What Is Graduated Licensing? Graduated Licensing is “a system designed to phase in young beginning [drivers]](/16/5025634/big_thumb.jpg "Graduated Driver Licensing: Is it effective?. What Is Graduated Licensing? Graduated Licensing is “a system designed to phase in young beginning [drivers]>")

