Download presentation
Presentation is loading. Please wait.

1
Regression Bivariate Multivariate

2
Simple Regression line – line of best fit Ŷ = a + bX The mean point is always on the line Y is the criterion variable X is the predictor variable (whenever this is appropriate)
")
3
The line gives mean relationship The standard error gives the variability We predict Y using the equation and then Compare that to the measurements of Y. This gives you the standard error of the estimate.

4
The regression line seeks to minimize the sum of the squared errors of prediction. The square root of the average squared error of prediction is used as a measure of the accuracy of prediction. This measure is called the standard error of the estimate and is designated as σ est. The formula for the standard error of the estimate is: where N is the number of pairs of (X,Y) points.
 points..")
5
An alternate formula for the standard error of the estimate is:. where is σy is the population standard deviation of Y and ρ is the population correlation between X and Ystandard deviationcorrelation

6
Simple (bivariate) UnivariateUnivariate Ŷ = a + bX Multivariate Ŷ = a + b 1 X 1 + b 2 X 2 + …..
 UnivariateUnivariate Ŷ = a + bX Multivariate Ŷ = a + b 1 X 1 + b 2 X 2 + …..")
7
Multivariate one predicted variable influenced by 2 or more other variables. Analyze all at once to find out how much of the relationship is explained by each of the factors.

8
Four measurements were made of male Egyptian skulls from five different time periods ranging from 4000 B.C. to 150 A.D. We wish to analyze the data to determine if there are any differences in the skull sizes between the time periods and if they show any changes with time. The researchers theorize that a change in skull size over time is evidence of the interbreeding of the Egyptians with immigrant populations over the years.

9
Max skull breadth Mb Basibregmatic height Bh Nasal height Nh Basioalveolar length Bl

10
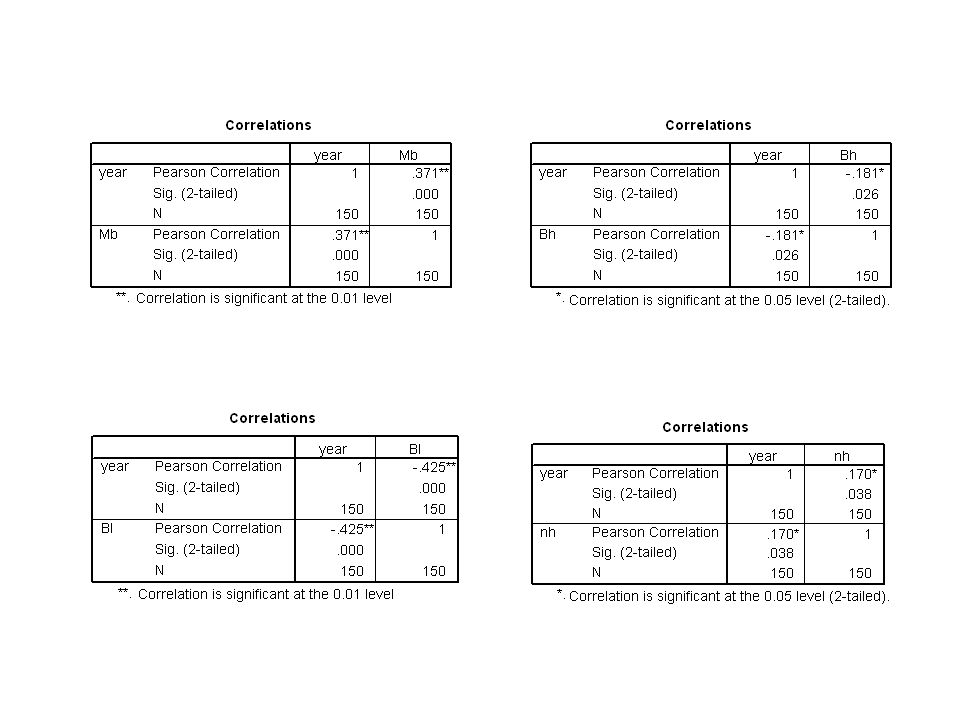
The scatterplots of measurements vs. Year. Four measurements of male Egyptian skulls from 5 different time periods. Thirty skulls are measured from each time period. The measurement MB appears to change more significantly with year than NH. Both MB and NH increase over time; however, plots of BH and BL vs. Year show that BH and BL decrease over time. In this study the direction of the change is not important since any change in skull size would be evidence of interbreeding.

12
Mb Ŷ = -18575.5 + 0.371Mb

13
Bh Ŷear = 6167.843 – 0.181Bh

14
Bl Ŷear = 10716.279 -0.425Bl

15
Nh Ŷear = -6271.2 + 0.170*nh

16
Individually the four measurements show change If add up the r 2 of all individual correlations – r 2 = 0.355 BUT they are interdependent. So this over-estimates the relationship

17
Because there are four different measurements that characterize skull size, we must use multivariate techniques that allow multiple dependent variables. Our dependent variables are the measurements MB, BH, BL, and NH. The predictor variable is Year.

19
A multivariate regression of the data, treating Year as a continuous predictor, shows that, when all four measurements are taken together, the measurements appear to change over the years Ŷear = -3687.401 + 0.287*Mb - 0.088Bh -0.356Bl +0.128nh

20
More complex methods Only include variables that are significantly contributing to the relationship. 307 if add up Bl Mb

22
Residuals The difference between Ŷ and the value of Y for each individual Can use this value to calculate R 2 The proportion of total variability of the Y scores that is accounted for by the regression equation

23
Can also calculate how much each variable contributes. Can use multiple regression to control for a third variable. Eliminate the influence of one variable and look at the remainder.

24
Factor Analysis Which variables go together? Identifies factors that group together. ANCOVA Anova with a covariate – able to control for a variable and then analyze.

25
Effect size for experiments Cohen’s d = mean1 – mean 2 sd For correlations r and r 2 give effect size sizedrr2r2 small0.20.11% medium0.50.2436% large0.80.37113.8% Very large1.10.51426.4% Extr large1.40.750%

26
Can compare very different types of information if you know the effect size Anxiety and depression Study 1 correlation 2 scales r =.37 Study 2 control and experimental reduced anxiety to see if impact on depression Change in depression Effect size d =.8 Same effect size

Similar presentations