Download presentation
Presentation is loading. Please wait.

1
ANZDATA Registry Annual Report 2013 STOCK AND FLOW CHAPTER 1

2
ANZDATA Registry Annual Report 2013 Figure 1.1 Patient Flow Summary 2008 - 2012 (Number Per Million Population at 31st December) * Country of Transplant 20082009201020112012 Australia Total New Patients 2551 (119)2431 (112)2330 (106)2496 (112)2534 (112) Total Transplants * 813 (38)773 (35)846 (38)825 (37)845 (37) Living Donor Transplants 354327296255238 Subsequent Transplants 105991028198 Total Deaths 16771692159817261606 Dialysis Patients 14931538141415021440 Transplant Patients 184154184224166 New Zealand Total New Patients 497 (116)584 (135)515 (118)485 (110)513 (116) Total Transplants * 122 (29)121 (28)110 (25)118 (27)108 (24) Living Donor Transplants 6967605754 Subsequent Transplants 1112689 Total Deaths 388365354413384 Dialysis Patients 360331319369355 Transplant Patients 2834354429 Notes: Figures for total transplants are by country of transplant. Figures for transplant deaths are by country of residence at time of death.

3
ANZDATA Registry Annual Report 2013 Figure 1.2 Prevalent Patients 2008 - 2012 (Number Per Million Population at 31st December ) 20082009201020112012 Australia Total 17824 (834)18512 (850) 19210 (871) 19913 (892)20766 (919) No. Transplants # 7654 (358)8047 (370)8506 (386)8878 (398)9320 (413) No. Dialysis Patients 10170 (476)10465 (481) 10704 (485) 11035 (494)11446 (507) Proportion Home * 31%30%29%28%29% Proportion Satellite HD 46%47%50%51%49% Proportion CAPD/APD 22%21%20%19% New Zealand Total 3456 (810)3685 (854)3828 (876)3872 (879)3993 (901) No. Transplants # 1350 (316)1404 (325)1440 (330)1483 (337)1524 (344) No. Dialysis Patients 2106 (493)2281 (529)2388 (547)2389 (542)2469 (557) Proportion Home * 52% 53%51%50% Proportion Satellite HD 19%18%17%15%16% Proportion CAPD/APD 36%35% 33%31% Country of Residence # Patients lost to follow up are not included Proportion of all patients dialysing currently receiving home-based treatment (either PD or HD)
8047 (370)8506 (386)8878 (398)9320 (413) No. Dialysis Patients (476)10465 (481) (485) (494)11446 (507) Proportion Home * 31%30%29%28%29% Proportion Satellite HD 46%47%50%51%49% Proportion CAPD/APD 22%21%20%19% New Zealand Total 3456 (810)3685 (854)3828 (876)3872 (879)3993 (901) No. Transplants # 1350 (316)1404 (325)1440 (330)1483 (337)1524 (344) No. Dialysis Patients 2106 (493)2281 (529)2388 (547)2389 (542)2469 (557) Proportion Home * 52% 53%51%50% Proportion Satellite HD 19%18%17%15%16% Proportion CAPD/APD 36%35% 33%31% Country of Residence # Patients lost to follow up are not included Proportion of all patients dialysing currently receiving home-based treatment (either PD or HD).")
4
ANZDATA Registry Annual Report 2013 Figure 1.6

5
ANZDATA Registry Annual Report 2013 Figure 1.7

6
ANZDATA Registry Annual Report 2013 Figure 1.8 Prevalent Transplant/Dialysis Patients by Indigenous Racial Origin, 2008 - 2012 (Number Per Million Population Per Year) Race 20082009201020112012 Aboriginal and Torres Strait Islanders # New Patients 251 (466)196 (356)206 (367)256 (446)254 (433) Dialysis 1163 (2160) 1184 (2153) 1214 (2161)1307 (2278)1425 (2431) Functioning Transplants * 159 (295)160 (291)177 (315)190 (331)193 (329) Transplant Operations 31 (58)24 (44)28 (50)28 (49)20 (34) Deaths 164 (305)174 (316)162 (288)149 (260)129 (220) Māori ^ New Patients 157 (244)177 (271)155 (233)129 (192)167 (244) Dialysis 689 (1072)733 (1123)761 (1146)746 (1108)773 (1130) Functioning Transplants * 112 (174)120 (184)130 (196)142 (211)149 (218) Transplant Operations 12 (19)19 (29)20 (30) 15 (22) Deaths 152 (236)126 (193)114 (172)131 (194)128 (187) Pacific People ^ New Patients 87 (274)103 (315)109 (325)95 (275)92 (261) Dialysis 434 (1365)490 (1500)542 (1615)568 (1646)600 (1699) Functioning Transplants * 83 (261)85 (260)86 (256)88 (255)89 (252) Transplant Operations 10 (31)6 (18)9 (27)9 (26)7 (20) Deaths 55 (173)48 (147)50 (149)61 (177)62 (176) * By Transplanting Country # Aboriginal and Torres Strait Islanders Combined ^ Māori and Pacific People data collected from patients living in New Zealand only
 Race Aboriginal and Torres Strait Islanders # New Patients 251 (466)196 (356)206 (367)256 (446)254 (433) Dialysis 1163 (2160) 1184 (2153) 1214 (2161)1307 (2278)1425 (2431) Functioning Transplants * 159 (295)160 (291)177 (315)190 (331)193 (329) Transplant Operations 31 (58)24 (44)28 (50)28 (49)20 (34) Deaths 164 (305)174 (316)162 (288)149 (260)129 (220) Māori ^ New Patients 157 (244)177 (271)155 (233)129 (192)167 (244) Dialysis 689 (1072)733 (1123)761 (1146)746 (1108)773 (1130) Functioning Transplants * 112 (174)120 (184)130 (196)142 (211)149 (218) Transplant Operations 12 (19)19 (29)20 (30) 15 (22) Deaths 152 (236)126 (193)114 (172)131 (194)128 (187) Pacific People ^ New Patients 87 (274)103 (315)109 (325)95 (275)92 (261) Dialysis 434 (1365)490 (1500)542 (1615)568 (1646)600 (1699) Functioning Transplants * 83 (261)85 (260)86 (256)88 (255)89 (252) Transplant Operations 10 (31)6 (18)9 (27)9 (26)7 (20) Deaths 55 (173)48 (147)50 (149)61 (177)62 (176) * By Transplanting Country # Aboriginal and Torres Strait Islanders Combined ^ Māori and Pacific People data collected from patients living in New Zealand only")
7
ANZDATA Registry Annual Report 2013 Figure 1.9 National and State Stock and Flow 1-Jan-2012 to 31-Dec-2012 (31-Dec-2011 Figures) State New Patients Transplan t Operation s * Deaths Dialysis Dependent + Functioning Transplants # * + Total Dialysis Transpla nt Queensland467 (451)164 (154)272 (315)31 (47)2085 (2012)1810 (1717)3895 (3729) New South Wales786 (780)224 (217)457 (482)47 (80)3707 (3574)2640 (2524)6347 (6098) Aust. Capital Territory 64 (53)16 (21)36 (27)4 (8)269 (264)226 (216)495 (480) Victoria628 (602)250 (255)343 (338)33 (38)2792 (2704)2493 (2352)5285 (5056) Tasmania47 (52)15 (23)32 (23)4 (1)214 (204)225 (221)439 (425) South Australia202 (183)78 (66)114 (110)26 (27)733 (712)952 (920)1685 (1632) Northern Territory98 (83)14 (11)47 (49)2 (4)502 (464)77 (68)579 (532) Western Australia242 (292)86 (87)139 (158)19 (19)1144 (1101)897 (860)2041 (1961) Australia 2534 (2496)847 (834)1440 (1502)166 (224)11446 (11035)9320 (8878)20766 (19913) New Zealand 513 (485)109 (121)355 (369)29 (44)2469 (2389)1524 (1483)3993 (3872) # Patients lost to follow-up are excluded * Resident State + Point Prevalence at 31 December
16 (21)36 (27)4 (8)269 (264)226 (216)495 (480) Victoria628 (602)250 (255)343 (338)33 (38)2792 (2704)2493 (2352)5285 (5056) Tasmania47 (52)15 (23)32 (23)4 (1)214 (204)225 (221)439 (425) South Australia202 (183)78 (66)114 (110)26 (27)733 (712)952 (920)1685 (1632) Northern Territory98 (83)14 (11)47 (49)2 (4)502 (464)77 (68)579 (532) Western Australia242 (292)86 (87)139 (158)19 (19)1144 (1101)897 (860)2041 (1961) Australia 2534 (2496)847 (834)1440 (1502)166 (224)11446 (11035)9320 (8878)20766 (19913) New Zealand 513 (485)109 (121)355 (369)29 (44)2469 (2389)1524 (1483)3993 (3872) # Patients lost to follow-up are excluded * Resident State + Point Prevalence at 31 December.")
8
ANZDATA Registry Annual Report 2013 Figure 1.10 Prevalent Transplant and Dialysis Patients 1991 to 2012 Country of Transplant (Number Per Million Population at 31 December) AustraliaNew Zealand YearTransplant #DialysisTotalTransplant #DialysisTotal 19913518 (204)3138 (182)6656 (385)600 (172)630 (180)1230 (352) 19923729 (213)3383 (193)7112 (407)671 (190)674 (191)1345 (381) 19933900 (221)3703 (210)7603 (430)702 (197)721 (202)1423 (398) 19944095 (229)4099 (230)8194 (459)729 (201)784 (217)1513 (418) 19954271 (236)4518 (250)8789 (486)782 (213)850 (231)1632 (444) 19964483 (245)4882 (267)9365 (512)822 (220)934 (250)1756 (471) 19974740 (256)5190 (280)9930 (536)878 (232)1017 (269)1895 (501) 19984970 (266)5536 (296)10506 (562)931 (244)1126 (295)2057 (539) 19995141 (272)6019 (318)11160 (590)978 (255)1230 (321)2208 (576) 20005350 (279)6409 (335)11759 (614)1020 (264)1331 (345)2351 (609) 20015572 (287)6851 (353)12423 (640)1060 (273)1462 (377)2522 (650) 20025858 (298)7263 (370)13121 (668)1113 (282)1594 (404)2707 (686) 20036089 (306)7719 (388)13808 (694)1164 (289)1711 (425)2875 (714) 20046395 (318)8004 (398)14399 (715)1218 (298)1774 (434)2992 (732) 20056656 (326)8642 (424)15298 (750)1243 (301)1878 (454)3121 (755) 20066987 (338)9263 (448)16250 (785)1256 (300)1997 (477)3253 (777) 20077251 (345)9731 (463)16982 (808)1300 (307)2071 (490)3371 (797) 20087654 (358)10170 (476)17824 (834)1350 (316)2106 (493)3456 (810) 20098047 (370)10465 (481)18512 (850)1404 (325)2281 (529)3685 (854) 20108506 (386)10704 (485)19210 (871)1440 (330)2388 (547)3828 (876) 20118878 (398)11035 (494)19913 (892)1483 (337)2389 (542)3872 (879) 20129320 (413)11446 (507)20766 (919)1524 (344)2469 (557)3993 (901) # Patients lost to follow-up are excluded
 AustraliaNew Zealand YearTransplant #DialysisTotalTransplant #DialysisTotal (204)3138 (182)6656 (385)600 (172)630 (180)1230 (352) (213)3383 (193)7112 (407)671 (190)674 (191)1345 (381) (221)3703 (210)7603 (430)702 (197)721 (202)1423 (398) (229)4099 (230)8194 (459)729 (201)784 (217)1513 (418) (236)4518 (250)8789 (486)782 (213)850 (231)1632 (444) (245)4882 (267)9365 (512)822 (220)934 (250)1756 (471) (256)5190 (280)9930 (536)878 (232)1017 (269)1895 (501) (266)5536 (296)10506 (562)931 (244)1126 (295)2057 (539) (272)6019 (318)11160 (590)978 (255)1230 (321)2208 (576) (279)6409 (335)11759 (614)1020 (264)1331 (345)2351 (609) (287)6851 (353)12423 (640)1060 (273)1462 (377)2522 (650) (298)7263 (370)13121 (668)1113 (282)1594 (404)2707 (686) (306)7719 (388)13808 (694)1164 (289)1711 (425)2875 (714) (318)8004 (398)14399 (715)1218 (298)1774 (434)2992 (732) (326)8642 (424)15298 (750)1243 (301)1878 (454)3121 (755) (338)9263 (448)16250 (785)1256 (300)1997 (477)3253 (777) (345)9731 (463)16982 (808)1300 (307)2071 (490)3371 (797) (358)10170 (476)17824 (834)1350 (316)2106 (493)3456 (810) (370)10465 (481)18512 (850)1404 (325)2281 (529)3685 (854) (386)10704 (485)19210 (871)1440 (330)2388 (547)3828 (876) (398)11035 (494)19913 (892)1483 (337)2389 (542)3872 (879) (413)11446 (507)20766 (919)1524 (344)2469 (557)3993 (901) # Patients lost to follow-up are excluded")
9
ANZDATA Registry Annual Report 2013 Figure 1.11

10
ANZDATA Registry Annual Report 2013 Figure 1.12

11
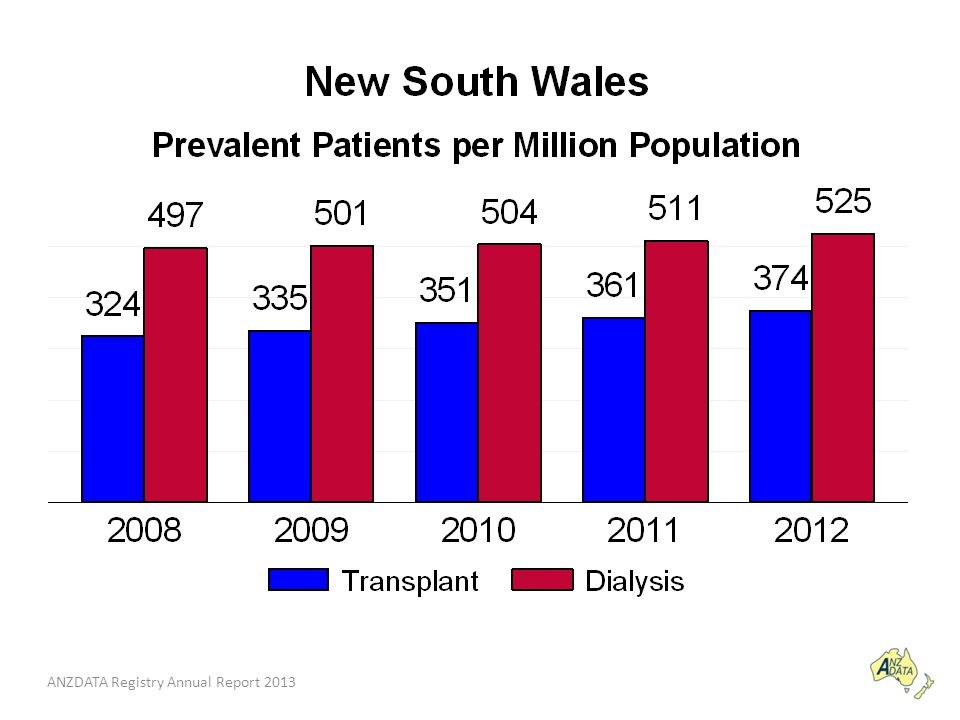
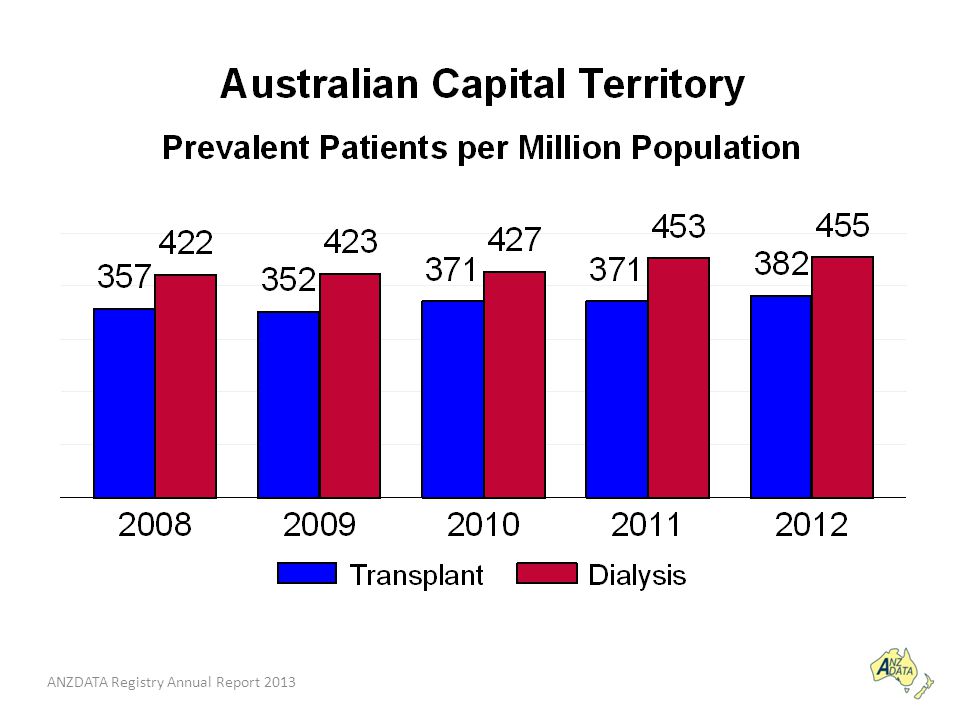
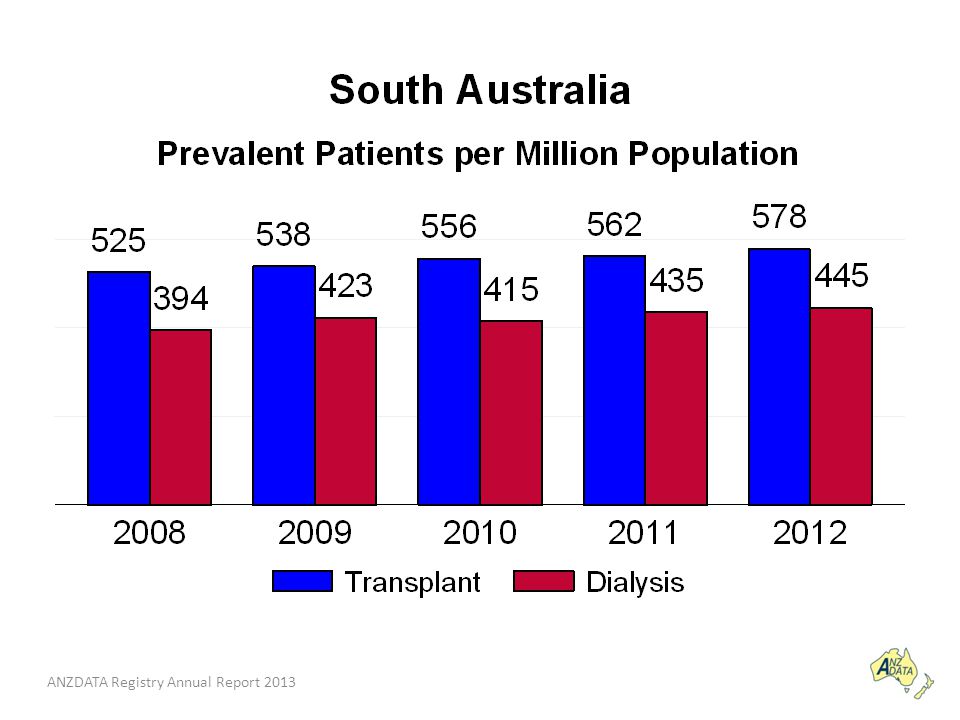
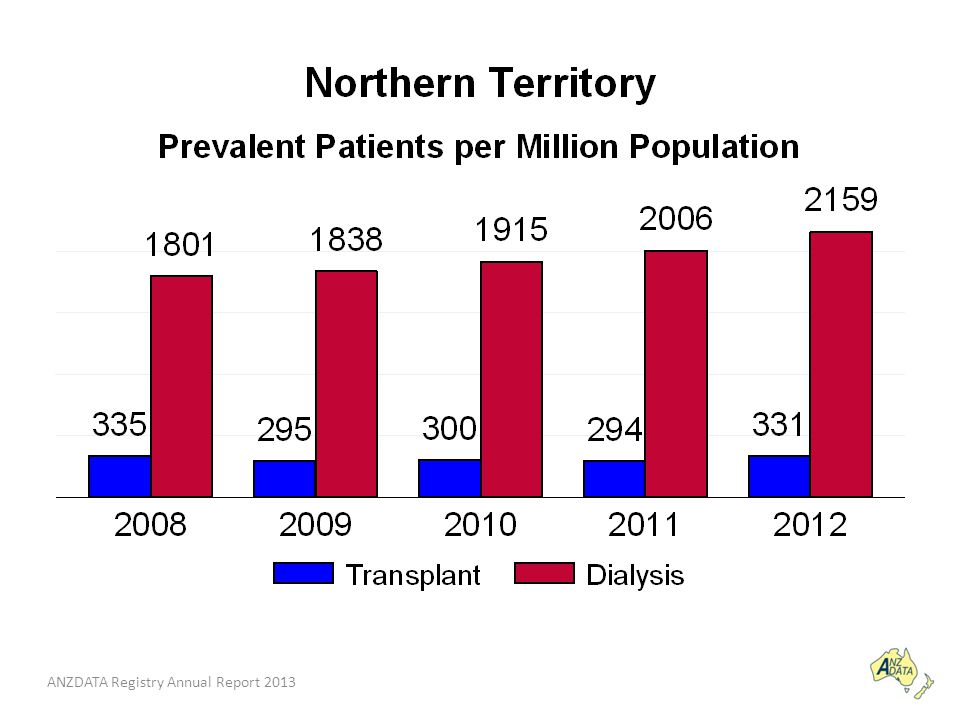
ANZDATA Registry Annual Report 2013 Figure 1.13 Comparison of Prevalent Transplant and Dialysis Dependent Patients 2008 - 2012 (Number Per Million Population at 31 December) 20082009201020112012 Transplants # Queensland1505 (352)1576 (361)1649 (373)1717 (384)1810 (400) New South Wales*2195 (324)2298 (335)2435 (351)2524 (361)2640 (374) Aust. Capital Territory*199 (357)199 (352)213 (371)216 (371)226 (382) Victoria1914 (362)2058 (381)2210 (404)2352 (425)2493 (445) Tasmania181 (363)194 (385)206 (405)221 (432)225 (437) South Australia838 (525)868 (538)906 (556)920 (562)952 (578) Northern Territory74 (335)67 (295)69 (300)68 (294)77 (331) Western Australia748 (343)787 (350)818 (356)860 (366)897 (372) Australia7654 (358)8047 (370)8506 (386)8878 (398)9320 (413) New Zealand1350 (316)1404 (325)1440 (330)1483 (337)1524 (344) # By Resident State and Country Dialysis Queensland1885 (441)1957 (448)2004 (453)2012 (450)2085 (461) New South Wales*3363 (497)3434 (501)3494 (504)3574 (511)3707 (525) Aust. Capital Territory*235 (422)239 (423)245 (427)264 (453)269 (455) Victoria2486 (470)2531 (469)2616 (478)2704 (489)2792 (498) Tasmania179 (359)199 (395)192 (378)204 (399)214 (416) South Australia630 (394)683 (423)677 (415)712 (435)733 (445) Northern Territory398 (1801)417 (1838)441 (1915)464 (2006)502 (2159) Western Australia994 (456)1005 (447)1035 (451)1101 (468)1144 (475) Australia10170 (476)10465 (481)10704 (485)11035 (494)11446 (507) New Zealand2106 (493)2281 (529)2388 (547)2389 (542)2469 (557) * NSW population excludes residents of the Southern Area Health Service * ACT population includes residents of the Southern Area Health Service (Medical services in the ACT service this Southern Area Region) Transplanted patients lost to follow up have been excluded
199 (352)213 (371)216 (371)226 (382) Victoria1914 (362)2058 (381)2210 (404)2352 (425)2493 (445) Tasmania181 (363)194 (385)206 (405)221 (432)225 (437) South Australia838 (525)868 (538)906 (556)920 (562)952 (578) Northern Territory74 (335)67 (295)69 (300)68 (294)77 (331) Western Australia748 (343)787 (350)818 (356)860 (366)897 (372) Australia7654 (358)8047 (370)8506 (386)8878 (398)9320 (413) New Zealand1350 (316)1404 (325)1440 (330)1483 (337)1524 (344) # By Resident State and Country Dialysis Queensland1885 (441)1957 (448)2004 (453)2012 (450)2085 (461) New South Wales*3363 (497)3434 (501)3494 (504)3574 (511)3707 (525) Aust. Capital Territory*235 (422)239 (423)245 (427)264 (453)269 (455) Victoria2486 (470)2531 (469)2616 (478)2704 (489)2792 (498) Tasmania179 (359)199 (395)192 (378)204 (399)214 (416) South Australia630 (394)683 (423)677 (415)712 (435)733 (445) Northern Territory398 (1801)417 (1838)441 (1915)464 (2006)502 (2159) Western Australia994 (456)1005 (447)1035 (451)1101 (468)1144 (475) Australia10170 (476)10465 (481)10704 (485)11035 (494)11446 (507) New Zealand2106 (493)2281 (529)2388 (547)2389 (542)2469 (557) * NSW population excludes residents of the Southern Area Health Service * ACT population includes residents of the Southern Area Health Service (Medical services in the ACT service this Southern Area Region) Transplanted patients lost to follow up have been excluded.")
12
ANZDATA Registry Annual Report 2013

Similar presentations


 Year Australia.>")


 632 (13%) 1317 (27%) 1335 (27%) Number of Patients Australia 31-Dec-96.>")

 2006 - 2010 ( ) Donors Per Million.>")


 2012 Annual Report—35th Edition ANZDATA.>")


