Download presentation
Presentation is loading. Please wait.

1
2015-20 Regulatory Proposal December 2014

2
We provide distribution services to 1.4 million residential and business customers We deliver electricity to a population base of 3.2 million people in the region Service an area of 25,000 km 2 from Gympie in the north to Withcott in the west, Stradbroke Island in the east and Coolangatta in the south Own and operate almost $12 billion in high performing network equipment We employ over 3,000 staff About us

3
Our proposal means that residential customers will experience real price reductions in the network component of their electricity retail bill to June 2020 We will deliver network price stability to reduce costs to customers and deliver a price decrease should the Queensland Government Solar Bonus Scheme be removed from our network prices. We will continue to deliver a safe and reliable electricity supply to homes and businesses and plan our network to meet future needs and technologies. We will continue to deliver services to our customers including demand management programs, easy to use communication channels, tree trimming, community safety as well as storm and emergency response. We commit to providing customers with a safe and reliable electricity supply as well as high standards of service. Revenue $8.4 billion* reduce upward price pressures deliver long-term network price stability for our customers. *Excluding approximately $1.4 billion in payments made under the Queensland Government Solar Bonus Scheme Capital expenditure $3.2 billion reduce capital expenditure maintain the current high levels of reliability improve reliability in network areas that are experiencing the most frequent power outages. Operating expenditure $1.7 billion maintain operating expenditure enhance engagement with our customers. Regulatory Proposal summary

4
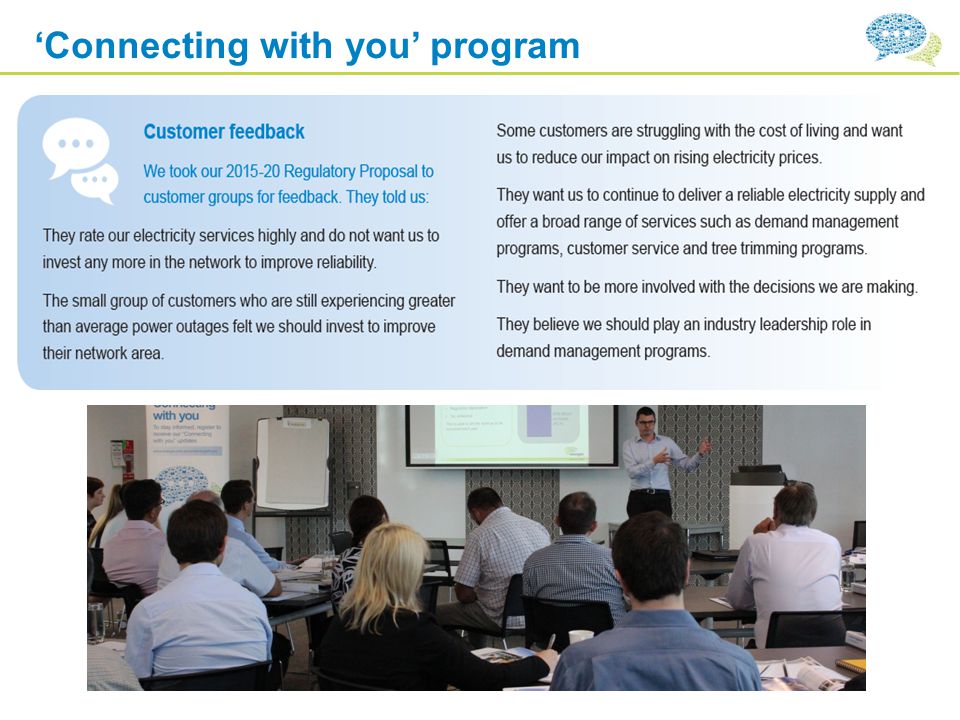
Our ‘Connecting with you’ program was established in early 2013 to ensure customer views and expectations are incorporated in key business decisions we are making. Through our Customer Engagement Research Program and our five year future plan consultation, over 6,700 customers influenced key decisions for our submission. ‘Connecting with you’ program

6
For the 2015-20 period, we will be seeking approval for $8.4 billion of revenue (excluding payments made under the Solar Bonus Scheme payments). The slight increase we are asking for during the 2015-20 period is due to growth in our asset base as we have invested in improvements to the electricity network during the 2010-15 period. Revenue Energex proposed Weighted Average Cost of Capital 7.75% A return on debt of 5.91 per cent A return on equity of 10.5 per cent Gearing of 60 per cent Gamma0.25

7
The green line represents the efficient revenue we need to run our business and the blue line represents the efficient revenue including the Queensland Government Solar Bonus Scheme. Revenue 2010-15 and 2015-20 yearly revenue

8
Network Tariff Code / Name Price unit2015-162016-172017-182018-192019-20 Expected network prices excluding Queensland Government Solar Bonus Scheme payments 8400 Residential Flat (default residential tariff) c/kWh13.5313.5713.3813.1813.00 Change from prior year-9.7%0.3%-1.4%-1.5%-1.4% $/customer588.73577.99562.23549.62539.02 Expected network prices including Queensland Government Solar Bonus Scheme payments 8400 Residential Flat (default residential tariff) c/kWh15.3215.6615.7415.8015.88 Change from prior year2.2%2.3%0.5%0.4%0.5% $/customer666.70667.17661.24658.77658.39 These prices exclude the cost of metering and GST Expected pricing outcomes Our proposal means that residential customers will experience real price reductions in the network component of their electricity retail bill to June 2020. Our network prices are based on our view of the efficient level of revenue we need to run our business which excludes Queensland Government Solar Bonus Scheme payments. If Solar Bonus Scheme payments were included, residential network prices would increase by around 2 per cent each year across the 2015-20 period.

9
Expected pricing outcomes - metering We intend to change the approach to metering and apply specific charges based on individual customer circumstances. This means the charges are being un-bundled from the cost that forms part of our overall revenue, paid for by everyone. Separating metering costs from other electricity charges allows customers to see what they are paying for. This also means there are opportunities for market competition in the future, meaning customers can choose a meter provider other than Energex to provide metering services. We have decided to charge a daily fee on a per tariff basis as this generally aligns to each individual customer’s metering needs.

10
Expected pricing outcomes For comparison purposes we have included the cost of metering in the above chart form 2015-16 onwards Residential Customers Average network charges – network tariff code 8400

11
For the 2015-20 period we will be seeking approval for $3.2 billion in capital expenditure which is a significant reduction of $1.2 billion compared to what we spent during the 2010-15 period. During the 2015-20 period, the majority of our efforts will be to replace network equipment that is at the end of its useful life. This will deliver ongoing community safety and high standards of network reliability. Capital expenditure – network investment

12
8% Buildings, IT, vehicles, tools & equipment Desktop and laptop computers used by the business / Cars, trucks, tools and equipment used to work on the network 15% Connecting new customers New supplies to large new developments such as the Bus and Train Tunnel, Moreton Rail Extension and other community infrastructure 22% Building new network New substations and circuits to supply growth areas / Flood defences at vulnerable substations / Improving reliability in worst performing supply areas / Resolving power quality issues caused by solar PV 55% Replacing ageing plant & equipment Replacing or repairing network equipment that is in poor condition or may be a safety risk / Replacing obsolete equipment such as the hardware and software used to operate and control the network Capital expenditure – network investment Breakdown of capital expenditure proposed for the 2015-20 period

13
Comparing 2010-15 with 2015-20 We are expecting a continued decrease in our capital expenditure Capital expenditure – network investment

14
Operating expenditure – our day to day services For the 2015-20 period we will be seeking approval for $1.7 billion in operating expenditure which is less than what we spent for the 2010-15 period. Operating expenditure will deliver the daily services our customers need and value. This includes the routine, ongoing activities of running an electricity network, emergency response, fixing faults, maintaining network equipment and demand management initiatives.

15
19% Tree trimming Trimming trees near powerlines to maintain high levels of reliability and community safety 5.5% Demand management Incentives to customers to reduce demand during peak times / Use of small generation as an alternative to building new network 12% Corrective repair Repairing or making safe equipment that fails in service 29% Maintenance Inspections / Planned maintenance 6.5% Customer services Customer Contact Centre / Network billing to electricity retailers / Hot water complaints 8.5% Operating the network Response to power outages / 24-hour control centre, including after hours emergency and loss of supply support 16% Other operating costs Levies / Debt raising costs / Self-insurance / Audit / Legal / Finance / Regulatory groups / Safety Programs / Community support and safety communications 3.5% Storms Emergency response and repairs to the network after a severe weather event Operating expenditure – our day to day services Breakdown of operating expenditure proposed for the 2015-20 period

16
Comparing 2010-15 with 2015-20 We are expecting a continued decrease in our operating expenditure Operating expenditure – our day to day services

17
Our proposal means that residential customers will experience real price reductions in the network component of their electricity retail bill to June 2020 We will deliver network price stability to reduce costs to customers and deliver a price decrease should the Queensland Government Solar Bonus Scheme be removed from our network prices. We will continue to deliver a safe and reliable electricity supply to homes and businesses and plan our network to meet future needs and technologies. We will continue to deliver services to our customers including demand management programs, easy to use communication channels, tree trimming, community safety as well as storm and emergency response. We commit to providing customers with a safe and reliable electricity supply as well as high standards of service. Revenue $8.4 billion* reduce upward price pressures deliver long-term network price stability for our customers. *Excluding approximately $1.4 billion in payments made under the Queensland Government Solar Bonus Scheme Capital expenditure $3.2 billion reduce capital expenditure maintain the current high levels of reliability improve reliability in network areas that are experiencing the most frequent power outages. Operating expenditure $1.7 billion maintain operating expenditure enhance engagement with our customers. Regulatory Proposal summary

Similar presentations