Download presentation
Presentation is loading. Please wait.

1
Reynier Peletier Secular Evolution and Stellar Populations Reynier Peletier Kapteyn Institute Groningen

2
Secular evolution and stellar populations: a critical look at early-type bulges: 1.Some colour maps of early-type bulges 2.The Ca II IR triplet in early-type bulges 3.Bulges on the fundamental plane of early-type galaxies 4.SAURON line strength maps of early-type bulges Collaborators: (1) M. Balcells; (2 and 3) M. Balcells, J. Falcón-Barroso, A. Vazdekis; (4) J. Falcón-Barroso, K. Fathi, E. Emsellem, M. Bureau, H. Kuntschner, R.L. Davies + rest of the SAURON team.
 M. Balcells, J. Falcón-Barroso, A. Vazdekis; (4) J. Falcón-Barroso, K. Fathi, E. Emsellem, M. Bureau, H. Kuntschner, R.L. Davies + rest of the SAURON team..")
3
A sample of highly inclined (i>50º) nearby galaxies to look at pure bulges with no disk contamination. Photometry of 45 nearby bulges (Balcells & Peletier 1994) (Andredakis et al. 1995) (Peletier & Balcells 1997) (Balcells et al. 2003, 2004a,b) Kinematics of 20 nearby bulges (Falcón-Barroso et al. 2003b) Stellar Populations of 20 bulges (Peletier et al. 1999) (Falcón-Barroso et al. 2002) (Falcón-Barroso et al. 2003a) 1. What do simple colour maps show?
 (Andredakis et al. 1995) (Peletier & Balcells 1997) (Balcells et al. 2003, 2004a,b) Kinematics of 20 nearby bulges (Falcón-Barroso et al. 2003b) Stellar Populations of 20 bulges (Peletier et al. 1999) (Falcón-Barroso et al. 2002) (Falcón-Barroso et al. 2003a) 1. What do simple colour maps show .")
4
Can we see the peanut-shaped bulge in the color maps? NGC 5965 – a galaxy with a peanut-shaped bulge (Sb) R-K colour map (Peletier & Balcells 1997) U-R colour map (Peletier & Balcells 1997)
 R-K colour map (Peletier & Balcells 1997) U-R colour map (Peletier & Balcells 1997).")
5
HST colour-colour maps of 20 S0-Sbc bulges Red: Central values Blue: Values at 0.5 R e. ==> Centers are dusty, and so contain young st. Populations (Peletier et al. 1999) NGC 5838 B-I (field size 5''x5'') What do optical-infrared colours tell us?
 NGC 5838 B-I (field size 5 x5 ) What do optical-infrared colours tell us .")
6
From the optical-infrared colour maps we infer: 1.These early-type bulges are predominantly old (~10 Gyr) with relatively small scatter (2 Gyr) 2.Bulge and inner disk populations are very similar (Peletier & Balcells 1996, Terndrup et al. 1994) 3.One does not see the bulge (classical nor peanut) in the colour maps, indicating also that there are no shocks etc. in the corners of the peanut that cause star formation. 4.There is residual dust and star formation in the centers
 3.One does not see the bulge (classical nor peanut) in the colour maps, indicating also that there are no shocks etc. in the corners of the peanut that cause star formation. 4.There is residual dust and star formation in the centers.")
7
(Cenarro et al. 2001, 2002ab, Vazdekis et al. 2003, Saglia et al. 2002, Falcon-Barroso et al. 2003, Cenarro et al. 2003) 2. Do stellar populations of bulges vary from those of ellipticals? The case of the Ca triplet.
 2. Do stellar populations of bulges vary from those of ellipticals. The case of the Ca triplet..")
8
(Cenarro et al. 2001a, 2001b, 2002) Advantages: Specifically designed to ease problems in the definition of the continuum bands Use all the S/N in the Ca triplet lines Are not very sensitive to problems with sky subtraction (5 continuum bands). Correct for Pa line contribution Calibrated with the stellar library of Cenarro et al. New near-IR index definitions CaT, CaT*,PaT
 Advantages: Specifically designed to ease problems in the definition of the continuum bands Use all the S/N in the Ca triplet lines Are not very sensitive to problems with sky subtraction (5 continuum bands). Correct for Pa line contribution Calibrated with the stellar library of Cenarro et al. New near-IR index definitions CaT, CaT*,PaT.")
9
● Ca II anti-correlates with ● No dependence on aperture size or morphological type. Discovery of a CaT* - σ relation for bulges (Falcon-Barroso et al. 2003)
.")
10
● Bulges of Spiral galaxies (filled symbols) follow the relation defined by elliptical galaxies (from Cenarro et al. 2003, open circles). The CaT* - σ relation is the same for bulges as for ellipticals.
. The CaT* - σ relation is the same for bulges as for ellipticals..")
11
How do we explain that CaT* decreases for larger galaxies?

12
Vazdekis et al. (2003) [M/H] GLOBULAR CLUSTERS Model prediction estimates Metallicity scale of Armandroff & Zinn (1988) For metallicities > -0.5 CaT* is virtually independent of metallicity.
 [M/H] GLOBULAR CLUSTERS Model prediction estimates Metallicity scale of Armandroff & Zinn (1988) For metallicities > -0.5 CaT* is virtually independent of metallicity..")
13
IMF slope AGEAGE [M/H] But CaT* does depend on IMF- slope!
![IMF slope AGEAGE [M/H] But CaT* does depend on IMF- slope!](http://images.slideplayer.com/12/3455930/slides/slide_13.jpg "IMF slope AGEAGE [M/H] But CaT* does depend on IMF- slope!")
14
● If [Ca/Fe] < 0 ● If Ca is depleted onto grains. This is not very likely, since the CaT* - σ relation for ellipticals (with less dust) is the same as for bulges. ● If the largest galaxies have IMFs that are biased towards low mass stars. The CaT* measurements in bulges can be explained
![● If [Ca/Fe] < 0 ● If Ca is depleted onto grains.](http://images.slideplayer.com/12/3455930/slides/slide_14.jpg "This is not very likely, since the CaT* - σ relation for ellipticals (with less dust) is the same as for bulges. ● If the largest galaxies have IMFs that are biased towards low mass stars. The CaT* measurements in bulges can be explained.")
15
(B92: Bender et al 1992, J96: JØrgensen et al. 1996) 3. Where do bulges fall on the Fundamental Plane of early-type galaxies? (Falcon-Barroso et al. 2002)
.")
16
(P98: Pahre et al. 1998) Bulges on the Fundamental Plane in the K-band
 Bulges on the Fundamental Plane in the K-band")
17
The position of bulges on the FP shows that these early-type bulges have the same age on the average as elliptical galaxies in clusters.

18
What does the Mg 2 – σ relation say about the ages of these bulges?

19
According to the Mg 2 -σ relation these bulges are old. However, there are other bulges that are apparently younger (e.g. most of those of Prugniel et al. 2001).
..")
20
H , [OIII], Mgb, Fe5270 Spectral features 14.7 %Total Efficiency William Herschel (4.2 m)Telescope ~ 110 km/sInstrumental resolution February 1999 (at WHT)Commissioned 4810-5350 ÅWavelength range 1577 (of which 146 sky)Lenslets 0.94 x 0.94 arcsecSampling 33 x 41 arcsecField of view 4. Absorption line strength maps of Early-type bulges with SAURON
![H , [OIII], Mgb, Fe5270 Spectral features 14.7 %Total Efficiency William Herschel (4.2 m)Telescope ~ 110 km/sInstrumental resolution February 1999 (at WHT)Commissioned ÅWavelength range 1577 (of which 146 sky)Lenslets 0.94 x 0.94 arcsecSampling 33 x 41 arcsecField of view 4.](http://images.slideplayer.com/12/3455930/slides/slide_20.jpg "Absorption line strength maps of Early-type bulges with SAURON.")
21
E ● S0 Sa The SAURON Sample: 24 E’s, 24 S0’s, 24 Sa’s. The SAURON sample is a representative sample of optically selected ellipticals, S0’s and spirals. Here I will show some absorption line strength maps for the 24 Sa galaxies.

22
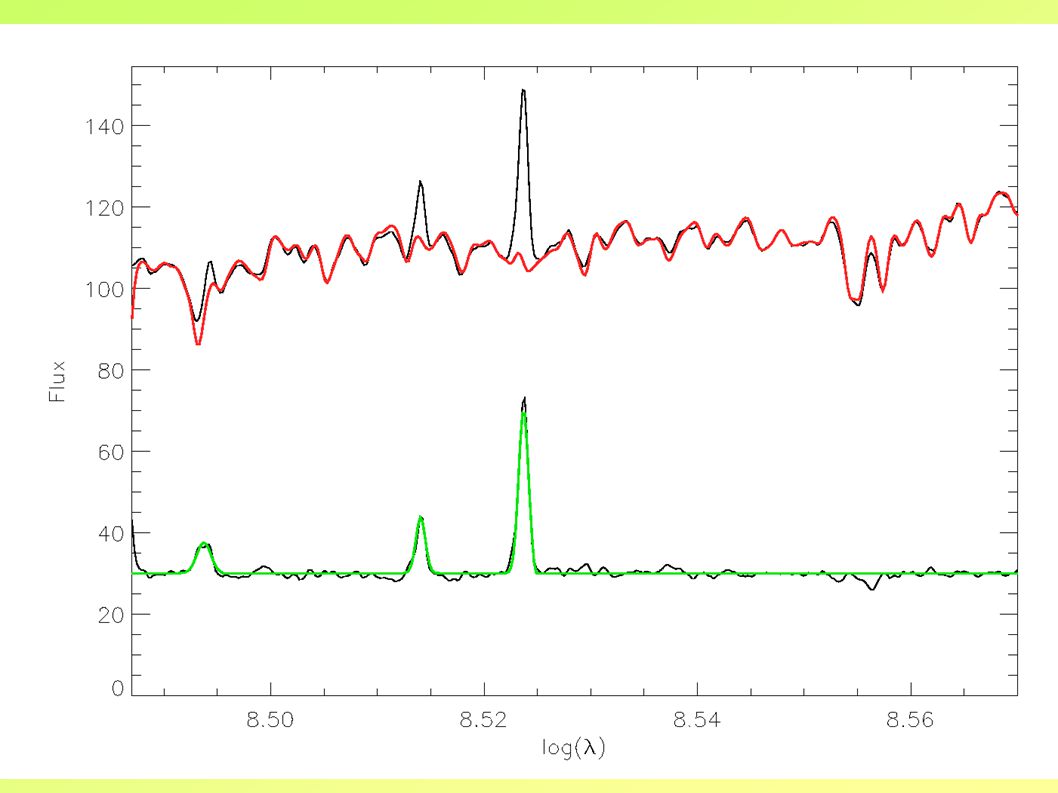
Separating gas and stars:

30
The system of line indices (Lick)
")
31
Some characteristic cases:

32
IMg b HβHβ V gas V stars Fe 5015 Central Star Formation: (SB(r)a: )
a: )")
33
IMgbHβHβ VgasVstarsFe 5015 Stellar Populations Ignoring the Bar: (SB(s)0-)
0-)")
34
MgbHβHβ VgasVstarsFe 5015 I A Central Star Formation Ring: (SB(rs)a)
a)")
35
What can we say about secular evolution from stellar populations? Bulges of early-type spirals (S0-Sb) look almost like elliptical galaxies: Similarities: 1.B-I; I-H colours similar to ellipticals of the same size. Old ages. 2.Bulges on the FP of ellipticals. 3.Same Mg 2 -σ and CaT*-σ relation 4.No features in colour maps 5.Some central (SF) activity Differences: 1.Sérsic index n lower (1-2.5 vs. 4)
 look almost like elliptical galaxies: Similarities: 1.B-I; I-H colours similar to ellipticals of the same size. Old ages. 2.Bulges on the FP of ellipticals. 3.Same Mg 2 -σ and CaT*-σ relation 4.No features in colour maps 5.Some central (SF) activity Differences: 1.Sérsic index n lower (1-2.5 vs. 4).")
36
BUT! -Bulges and inner disks are indistinguishable in the colour maps Bulges of later types are different: 1.Star clusters (nuclear and non-nuclear) 2.Presence of Star Formation (in Rings etc.) 3.Surface brightness profiles even shallower (n~1) Clearly, later type bulges are evolving as we speak. About the details, however, we know very little.
 2.Presence of Star Formation (in Rings etc.) 3.Surface brightness profiles even shallower (n~1) Clearly, later type bulges are evolving as we speak. About the details, however, we know very little..")
37
First Light of VISIR VISIR is a mid-infrared imager and spectrograph, built by CEA- Saclay (France) and ASTRON (Dwingeloo) for ESO’s VLT. It has the following capabilities: - Diffraction limited imaging from 5-28 micron (0.2’’ at 8 micron!) - Spectroscopy at resolution 300, 3000 and 30000. VISIR obtained first light on April 30, 2004.
 - Spectroscopy at resolution 300, 3000 and VISIR obtained first light on April 30,")
38
Some Early VISIR-Results Galactic center at 8.6 (PAH), 12.8 (NeII) and 19.5 micron.
, 12.8 (NeII) and 19.5 micron.")
39
The Ant Nebula HST VISIR – 12.8 micron, Field of View 33x33’’ VISIR: NeII line at 12.8 micron, x-v diagram; scale 33’’ x 700 km/s

Similar presentations


>")


 Comparison with our determination: Relative.>")


