Download presentation
Presentation is loading. Please wait.

1
4.3 Connecting f’ and f’’ with the Graph of f
Objectives SWBAT: 1) use the first and second derivative tests to determine the local extreme values of a function 2) determine the concavity of a function and locate the points of inflection by analyzing the second derivative 3) graph f using information about f’
 use the first and second derivative tests to determine the local extreme values of a function. 2) determine the concavity of a function and locate the points of inflection by analyzing the second derivative. 3) graph f using information about f’")
2
The First Derivative Test and Local Extrema
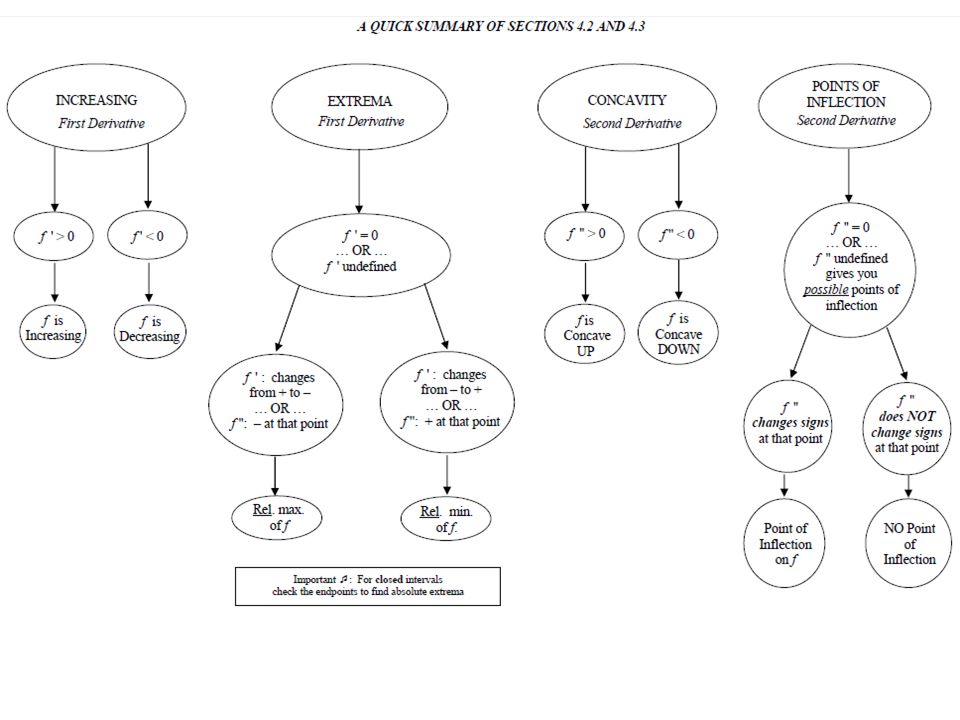
Let f be a continuous function, and let c be a critical point. If f’ changes sign from positive to negative at c, then f has a local maximum value at c. If f’ changes sign from negative to positive at c, then f has a local minimum value at c. If f’ DOES NOT change signs, then there is no local extreme value at c.

5
Concavity

6
Notice that on concave down intervals the tangent lines (from left to right) decrease in slope, and on concave up intervals the tangent lines (from left to right) increase in slope.
 decrease in slope, and on concave up intervals the tangent lines (from left to right) increase in slope.")
7
If the first derivative is increasing, then the second derivative must be positive.
If the first derivative is decreasing, then the second derivative must be negative. Instead of using the definition of concavity to determine whether the function is concave up or concave down, we can use the concavity test .

8
Note: Concavity intervals are always open
Note: Concavity intervals are always open!!! Use parentheses, not brackets.

10
Above is the sign chart from the previous slide.
Note that the concavity changes at x=-2 and at x=0. These points are known as points of inflection.

11
Points of Inflection definition
A point where the graph of a function has a tangent line (even if it’s a vertical tangent line) AND where the concavity changes is a point of inflection. To summarize: Since points of inflection occur when the graph changes concavity and a graph changes concavity when the 2nd derivative changes from positive to negative (or vice-versa), then if we wanted to find the points of inflection of a graph, we only need to focus on when the second derivative equals 0 or does not exist.
 AND where the concavity changes is a point of inflection. To summarize: Since points of inflection occur when the graph changes concavity and a graph changes concavity when the 2nd derivative changes from positive to negative (or vice-versa), then if we wanted to find the points of inflection of a graph, we only need to focus on when the second derivative equals 0 or does not exist.")
13
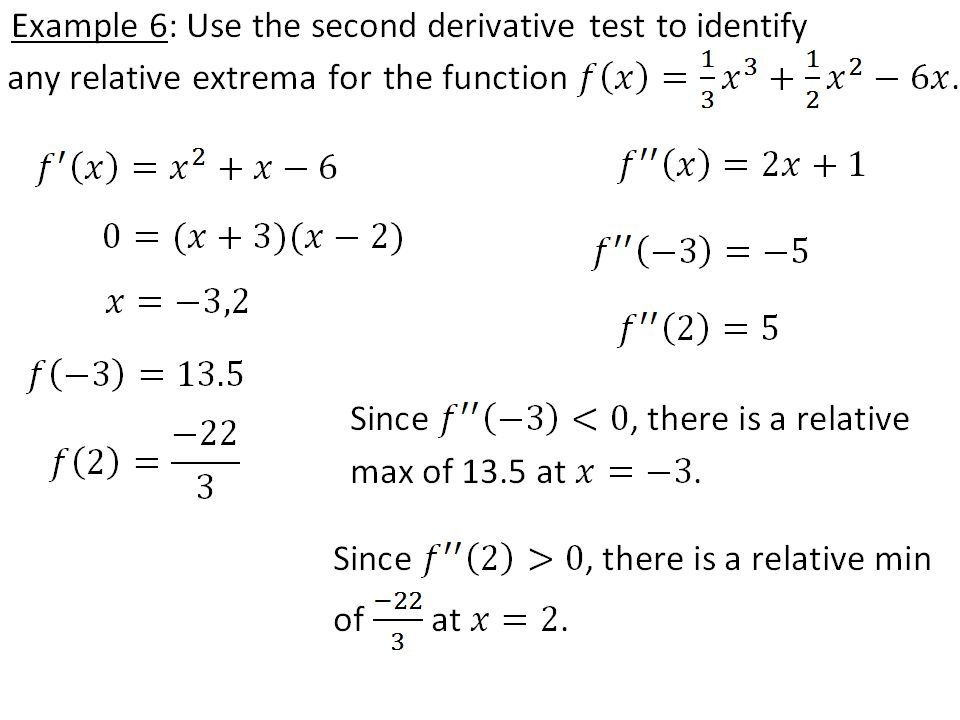
Second Derivative Test
Concavity can help us determine whether an extreme point is a maximum or minimum value. As long as a function is twice-differentiable (meaning the first derivative is a smooth curve), then we can determine whether or not a critical point is a relative maximum or minimum WITHOUT creating a sign chart. This can be done by using the Second Derivative Test.
, then we can determine whether or not a critical point is a relative maximum or minimum WITHOUT creating a sign chart. This can be done by using the Second Derivative Test.")
14
Second Derivative Test for Local Extrema
Second note: This only works for RELATIVE max and min values.

17
Notes for Optimization Problems
Whenever you are required to Maximize or Minimize a function, you MUST justify whether or not your answer is actually a maximum or a minimum. You may use the First Derivative Test (make a sign chart and test points) or the Second Derivative Test (substitute the critical values into the second derivative). Always remember that both of these tests are checking for relative extrema. If you have a CLOSED interval, you must check the endpoints to make sure the absolute maximum or minimum values do not happen to occur there. If you have a closed interval, it is best just to check ALL critical points and endpoints.
 or the Second Derivative Test (substitute the critical values into the second derivative). Always remember that both of these tests are checking for relative extrema. If you have a CLOSED interval, you must check the endpoints to make sure the absolute maximum or minimum values do not happen to occur there. If you have a closed interval, it is best just to check ALL critical points and endpoints.")
Similar presentations


 = 3x4 – 4x3 – 12x2 + 5>")


 December 4th, 2012.>")
 = sinxcosx;>")


There is an absolute maximum value at x = c iff f(c) f(x) for all x in the entire domain.>")

, skip 57, 69 Rogawski Calculus Copyright © 2008 W. H. Freeman and Company.>")


, R(x), P(x), S(x) For our purposes, marginal functions represent.>")

