Download presentation
Presentation is loading. Please wait.

1
CSUSM Smoking and GPA Analysis Business Statistics 304 Walter Evans Farzana Mohsini Sheryl Lejano Ryan Thomas

2
Three Reasons Students smoke for pleasure. Students’ smoking habits may be tied to a person’s family history. Smoking may depend of student age and knowledge.

3
Mission Statement Smoking has a negative, positive or neutral impact on the success of students. Our analysis will assist us in planning and implementing smoking intervention programs for Cal State San Marcos. Programs may be helpful in preventing the habit of tobacco use in school. Help us take action in making an effort to inform the council and promote a lesser degree of smoking on campus. Our group would like to determine whether or not smoking on campus is decreasing or increasing and why that is so. To properly evaluate the extensiveness of a student smoker’s habits and the level of success a student has accomplished.

4
Cal State San Marcos Smoking Survey Gender: Male Female Class:Freshman SophomoreJunior Senior Age:17-20 21-24 25-28 29-32 33-36 37-40 >40 What is your major? _____________ What is your G.P.A.? 3.6 Do you have a family history of smoking?YES NO When I see a person smoking, it… makes him/her more attractive. makes him/her less attractive has no impact on their attractiveness. Would you date a person who is smoker? YES NO Do you smoke tobacco? YES NO If YES, how many times do you smoke a day? 1-3 times 4-6 times 7-9 times >10 times How long have you been smoking? 10 years Thank you for your help on this research project! It is greatly appreciated!

5
Excel Spreadsheet Set-up # Gender Class Age Major G.P.A. History Attractiveness Date? Smoke Per Day Years

6
Related Information Causes for Smoking. Time of day (cigarettes/day) Duration of smoking Family History of smoking Student smoking percentage number of student smokers Given the nature and the student lifestyle, we expect 17% of our surveyed sample to be smokers. Proceed in our research by surveying 105 students on campus to operate as a sample for the standard population of the school.
 Duration of smoking Family History of smoking Student smoking percentage number of student smokers Given the nature and the student lifestyle, we expect 17% of our surveyed sample to be smokers. Proceed in our research by surveying 105 students on campus to operate as a sample for the standard population of the school..")
7
Background Information/Factors Health risks (first and second hand) Cancer susceptibility based on time spent on campus in direct connection with smoking Comparing and contrasting smoker comfort versus non-smoker discomfort Non-smokers hidden annoyances toward smoking Smoker’s Nonsmokers awareness of nonsmokers smokers Determining possible reasons for smoking (stress, habit, social conformity?)
 Cancer susceptibility based on time spent on campus in direct connection with smoking Comparing and contrasting smoker comfort versus non-smoker discomfort Non-smokers hidden annoyances toward smoking Smoker’s Nonsmokers awareness of nonsmokers smokers Determining possible reasons for smoking (stress, habit, social conformity )")
8
Mean, Variance, Frequency and Mode

9
Mean for Age Used midpoints Total, Non-Smoking, & Smoking Mean Total Students Age# of Students 18.520 22.557 26.514 30.57 34.50 38.51 >405 Mean 23.80288462 Mean Non-Smoking Age# of Students 18.515 22.552 26.511 30.56 34.50 38.50 >405 Mean 23.84269663 Mean Smoking Age# of Students 18.55 22.55 26.53 30.51 34.50 38.51 >400 Mean 23.56666667

10
Mean, Variance & Standard Deviation for GPA Used Midpoints Total, Non-Smoking, & Smoking Mean GPA Total < 2.00 2.2053 2.60521 3.00525 3.40544 > 3.611 Mean 3.133317308 Variance Std Dev Mean GPA Smoking < 2.00 2.2051 2.6055 3.0054 3.4055 > 3.60 Mean 2.951666667 Variance Std Dev Mean GPA Non- Smoking < 2.00 2.2052 2.60516 3.00521 3.40539 > 3.611 Mean 3.163932584 Variance Std Dev

11
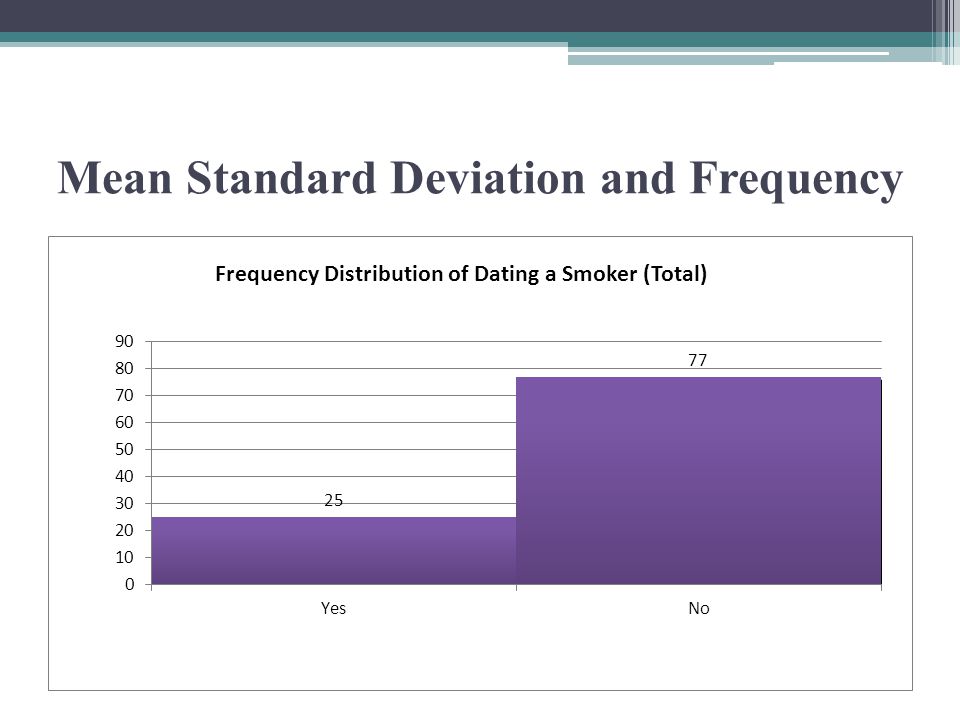
Mean Standard Deviation and Frequency Mean = 23.80288462 Standard Deviation = 5.026830087

12
Mean Standard Deviation and Frequency Mean = 23.84269663 Standard Deviation = 4.966704771

13
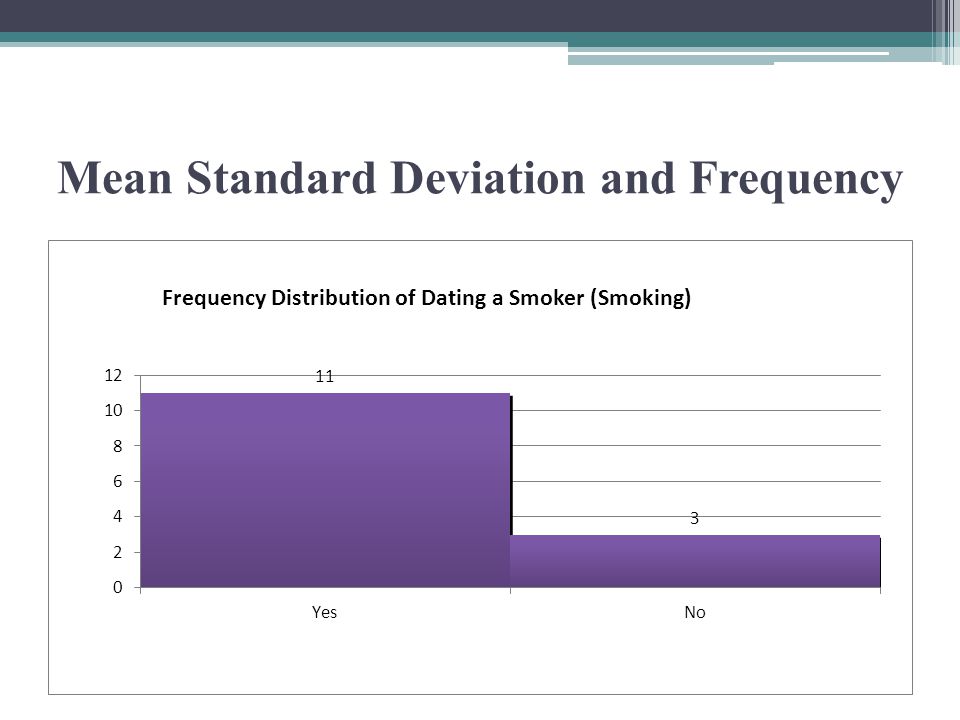
Mean Standard Deviation and Frequency Mean = 23.56666667 Standard Deviation = 5.548058433

14
Mean Standard Deviation and Frequency Mean = 3.133317308 Standard Deviation = 0.37522654

15
Mean Standard Deviation and Frequency Mean = 3.163932584 Standard Deviation = 0.365036947

16
Mean Standard Deviation and Frequency Mean = 2.951666667 Standard Deviation = 0.396172161

17
Mean Standard Deviation and Frequency Mean = 4.769230769 Standard Deviation = 3.491748515

18
Mean Standard Deviation and Frequency Mean = 3.4 Standard Deviation = 3.10617959

19
Mean Standard Deviation and Frequency

28
Conditional Probability Conditional Probability Rules: 15 Smokers90 Nonsmokers 11 Smoker Male 4 Smoker Female Total Population: 43 Female 62 Males Continuous Variables Probability Rule 4: Addition Rule for Any Two Events, E1 and E2 P(E1 or E2)=P(E1)+P(E2)-P(E1 and E2).
=P(E1)+P(E2)-P(E1 and E2).")
29
Mutually Exclusive Events Probability Rule 5: Addition Rule for Mutually Exclusive Events Two Mutually Exclusive Events E1 and E2 ↑ E1 and E2 E1E2

30
Conditional Probability Table 1. SmokerNonsmoker Male1151Total 105 Female439 Table 2. GPA>3.0GPA<3.0 Smoking Male74Total 15 Smokers Smoking Female22

31
Graphical Representation GPA>3.0GPA<3.0 Smoking Male74Total 15 Smokers Smoking Female22

32
Graphical Representation GPA>3.0GPA<3.0 Smoking Male74Total 15 Smokers Smoking Female22

33
Conditional Probability Table 3. GPA>3.0GPA<3.0Total 90 Nonsmokers Nonsmoking Male381351 Males Nonsmoking Female30939 Females

34
Conditional Probability Table 5. Age > 20Age ≤20Total 105 Male5111 62 Males Female3310 43 Females Table 6. Age > 20Age ≤20Total 15 Male Smokers83 11 Males Smokers Female Smokers22 4 Females Smokers

35
Conditional Probability Event 1= Male P(E1)=62/1050.590476 Event 2= Female0.409524 P(E2)=43/105 P(E1 or E2)=P(E1)+P(E2)-P(E1 and E2).590476+.409524-0=1.0 Probability of Either a Male or Female
=62/ Event 2= Female P(E2)=43/105 P(E1 or E2)=P(E1)+P(E2)-P(E1 and E2) =1.0 Probability of Either a Male or Female")
36
Conditional Probability P(E1 and E2) 4/105=.0380 Probability of Female and Smoker Event 1= Female P(E1)=43/105 0.40952 4 Event 2=Smoker P(E2)=15/105 0.14285 7 P(E1 or E2)=P(E1)+P(E2)-P(E1 and E2).409524+.142857-.0380=0.514381 Probability of Either Female or smoker
 4/105=.0380 Probability of Female and Smoker Event 1= Female P(E1)=43/ Event 2=Smoker P(E2)=15/ P(E1 or E2)=P(E1)+P(E2)-P(E1 and E2) = Probability of Either Female or smoker")
37
Conditional Probability P(E1 and E2) 11/105=.10476 Probability of Male and Smoker Event 1= Male P(E1)=62/105 0.5904 76 Event 2=Smoker P(E2)=15/105 0.1428 57 P(E1 or E2)=P(E1)+P(E2)-P(E1 and E2).590476+.142857-.10476=0.342859 Probability of Either Male or Smoker
 11/105= Probability of Male and Smoker Event 1= Male P(E1)=62/ Event 2=Smoker P(E2)=15/ P(E1 or E2)=P(E1)+P(E2)-P(E1 and E2) = Probability of Either Male or Smoker")
38
Gender Vs. GPA (Male) Event 1= Male P(E1)=62/105.5905 Probability Event 2= GPA > 3.0 P(E2)=77/105.73333 Probability P(E1 and E2) 45/105=.42857 Probability of Male and GPA > 3.0
 Event 1= Male P(E1)=62/ Probability Event 2= GPA > 3.0 P(E2)=77/ Probability P(E1 and E2) 45/105= Probability of Male and GPA > 3.0.")
39
Gender Vs. GPA (Female) Event 1= Female P(E1)=43/1050.409524 Event 2= GPA > 3.0 P(E2)=77/105.73333 Probability P(E1 and E2) 32/105=.30476 Probability of Female and GPA > 3.0
 Event 1= Female P(E1)=43/ Event 2= GPA > 3.0 P(E2)=77/ Probability P(E1 and E2) 32/105= Probability of Female and GPA > 3.0.")
40
Smoking Vs. GPA (Male) Event 1= Male Smoker 11/105=.10476 Probability of Male and Smoker Event 2= GPA > 3.0 P(E2)=77/105.73333 Probability P(E1 and E2) 7/105=.066667 Probability of Male Smoker and GPA > 3.0
 Event 1= Male Smoker 11/105= Probability of Male and Smoker Event 2= GPA > 3.0 P(E2)=77/ Probability P(E1 and E2) 7/105= Probability of Male Smoker and GPA > 3.0.")
41
Smoking Vs. GPA (Female) Event 1= Female Smoker 4/105=.0380 Probability of Female and Smoker Event 2= GPA > 3.0 P(E2)=77/105.73333 Probability P(E1 and E2) 2/105=.0190 Probability of Female Smoker and GPA > 3.0
 Event 1= Female Smoker 4/105=.0380 Probability of Female and Smoker Event 2= GPA > 3.0 P(E2)=77/ Probability P(E1 and E2) 2/105=.0190 Probability of Female Smoker and GPA > 3.0.")
42
Binomial Formula P(x) n x ! nx pq x n x ! ()! = - - n= Random Sample Size x= Number of successes n-x= Number of Failures p= probability of a success0.14285714 q=1-p = Probability of a failure0.85714286 n!=n(n-1)(n-2)(n-3)…1 0!=1 by definition 307.56E-06 Random 30 variable sample FACTORIAL P(x)= 30!(.14285714) power of 4(.85714286) power of 26 4!(30-4)!4.16E-040.0181712
(n-2)(n-3)…1 0!=1 by definition E-06 Random 30 variable sample FACTORIAL P(x)= 30!( ) power of 4( ) power of 26 4!(30-4)!4.16E")
43
Sampling Error TotalNon-smokersSmokers Population Mean3.133.162.95 Sample Mean3.1376673.103.08 Error0.004349-0.060.13 Comparing GPA to non-smokers and smokers. Using a Cluster Sample technique and a random number generator Population size (105) Sample sizes: Total (30), non-smokers (20), and smokers (5 )
 Sample sizes: Total (30), non-smokers (20), and smokers (5 ).")
44
Margin of Error Margin of error in GPA compared to non-smokers and smokers. Population size (105) Sample sizes : Total (30), non-smokers (20), and smokers (5) TotalNon-SmokersSmokers Population Mean3.133.162.95 Population S.D.0.3750.3650.396 Sample Mean3.133.103.08 Confidence Interval95% Margin of Error0.130.150.35 Range3.00 – 3.262.95 – 3.252.73 – 3.43
 Sample sizes : Total (30), non-smokers (20), and smokers (5) TotalNon-SmokersSmokers Population Mean Population S.D Sample Mean Confidence Interval95% Margin of Error Range3.00 – – –")
45
Hypothesis test non-smokers Lower tail t-test Null Hypothesis of a 2.00 GPA If lower, then reject. Level of significance (0.02) TotalNon-smokers Data Null Hypothesis = 2 Level of Significance0.02 Sample Size30 Sample Mean3.13 Sample Standard Deviation0.417219 Intermediate Calculations Standard Error of the Mean0.076173419 Degrees of Freedom29 t Test Statistic14.83457105 Lower-Tail Test Lower Critical Value-2.150325074 p-Value1 Do not reject the null hypothesis Data Null Hypothesis = 2 Level of Significance0.02 Sample Size20 Sample Mean3.1 Sample Standard Deviation0.357627 Intermediate Calculations Standard Error of the Mean0.079967828 Degrees of Freedom19 t Test Statistic13.75553174 Lower-Tail Test Lower Critical Value-2.204701336 p-Value1 Do not reject the null hypothesis
 TotalNon-smokers Data Null Hypothesis = 2 Level of Significance0.02 Sample Size30 Sample Mean3.13 Sample Standard Deviation Intermediate Calculations Standard Error of the Mean Degrees of Freedom29 t Test Statistic Lower-Tail Test Lower Critical Value p-Value1 Do not reject the null hypothesis Data Null Hypothesis = 2 Level of Significance0.02 Sample Size20 Sample Mean3.1 Sample Standard Deviation Intermediate Calculations Standard Error of the Mean Degrees of Freedom19 t Test Statistic Lower-Tail Test Lower Critical Value p-Value1 Do not reject the null hypothesis.")
46
Hypothesis test smokers Lower tail t-test Null Hypothesis of a 2.00 GPA If lower, then reject. Level of significance (0.02) TotalSmokers Data Null Hypothesis = 2 Level of Significance0.02 Sample Size30 Sample Mean3.13 Sample Standard Deviation0.417219 Intermediate Calculations Standard Error of the Mean0.076173419 Degrees of Freedom29 t Test Statistic14.83457105 Lower-Tail Test Lower Critical Value-2.150325074 p-Value1 Do not reject the null hypothesis Data Null Hypothesis = 2 Level of Significance0.02 Sample Size5 Sample Mean3.08 Sample Standard Deviation0.334664 Intermediate Calculations Standard Error of the Mean0.149666291 Degrees of Freedom4 t Test Statistic7.21605376 Lower-Tail Test Lower Critical Value-2.998527873 p-Value0.999022157 Do not reject the null hypothesis
 TotalSmokers Data Null Hypothesis = 2 Level of Significance0.02 Sample Size30 Sample Mean3.13 Sample Standard Deviation Intermediate Calculations Standard Error of the Mean Degrees of Freedom29 t Test Statistic Lower-Tail Test Lower Critical Value p-Value1 Do not reject the null hypothesis Data Null Hypothesis = 2 Level of Significance0.02 Sample Size5 Sample Mean3.08 Sample Standard Deviation Intermediate Calculations Standard Error of the Mean Degrees of Freedom4 t Test Statistic Lower-Tail Test Lower Critical Value p-Value Do not reject the null hypothesis.")
47
Correlation GPA of non-smokers

48
Correlation GPA and smokers

49
Correlation Regression

50
Conclusion There is no correlation between smoker and non-smoker Based on our data, mean for smokers has a lower GPA compare to non-smokers Although our data revealed a low percentage of smokers within a 105 person population as a group based on this result we conclude the percentage of smoking amongst the campus population is relatively low.

51
Suggestion Make smoker-free campus. Switch the smoking designated area - General Lots - (Lots J, K, L, N, O, X, Y, and Z ). Promote non- smoking habit by encouraging students.
. Promote non- smoking habit by encouraging students..")
Similar presentations


 2.Divide the range of possible values for the test.>")


