Download presentation
Presentation is loading. Please wait.

1
Evolution at Multiple Loci: Quantitative Genetics

2
I. Rediscovery of Mendel and Challenges to Natural Selection Do traits that exhibit continuous variation have a genetic basis? If the only traits which have genetic variation are controlled by one or two loci then natural selection not as important as mutation Darwin envisioned evolution to be a continuous process of selection acting on limitless genetic variation, with small changes occurring in any one generation, but large changes occurring over long periods.

3
Why the normal distribution: Central Limit Theorem

4
Mendelian genetics can explain quantitative traits Ex. 1: NILSSON-EHLE: Red and White Kernel Color in Wheat (red dominant, white recessive) Ex. 2: East’s work with tobacco
 Ex. 2: East’s work with tobacco.")
6
Quantitative traits are influenced by the environment as well as genotype Yarrow plant

7
1. Fisher’s prediction Mutation Effect Probability of Fixation 2. Kimura’s modification 3. Orr’s modification II. Neo Darwinian Synthesis Theoretical models that support vs. contend the Darwinian model

8
Typical results Corolla Width (mm) F2 BC F1 M. micranthus M. guttatus F1 F2 Fenster & Ritland 1994 Testing the Models:

12
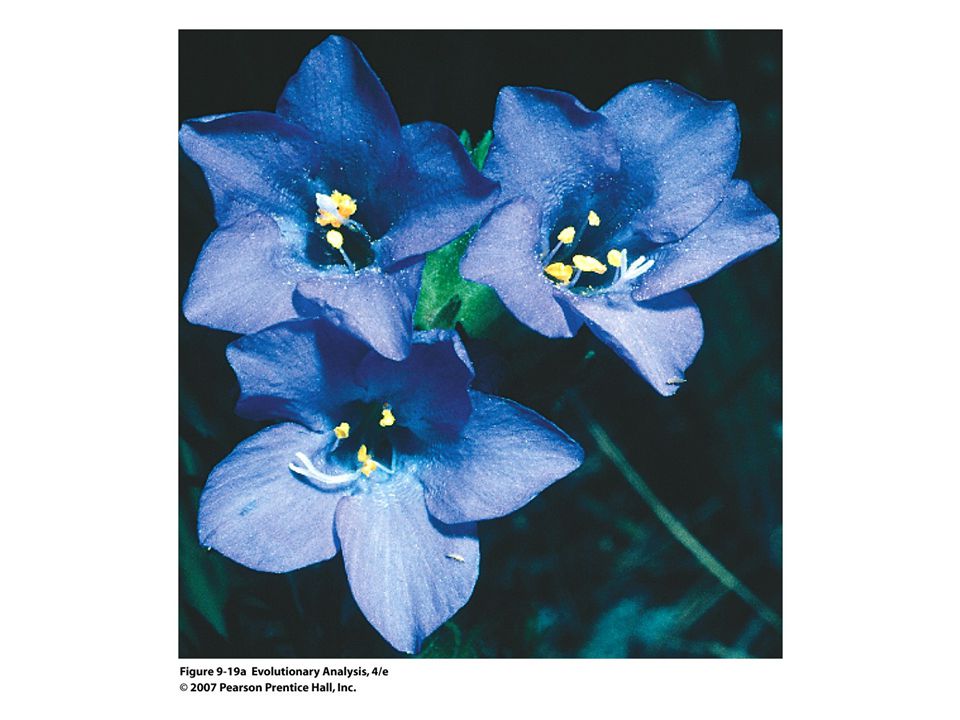
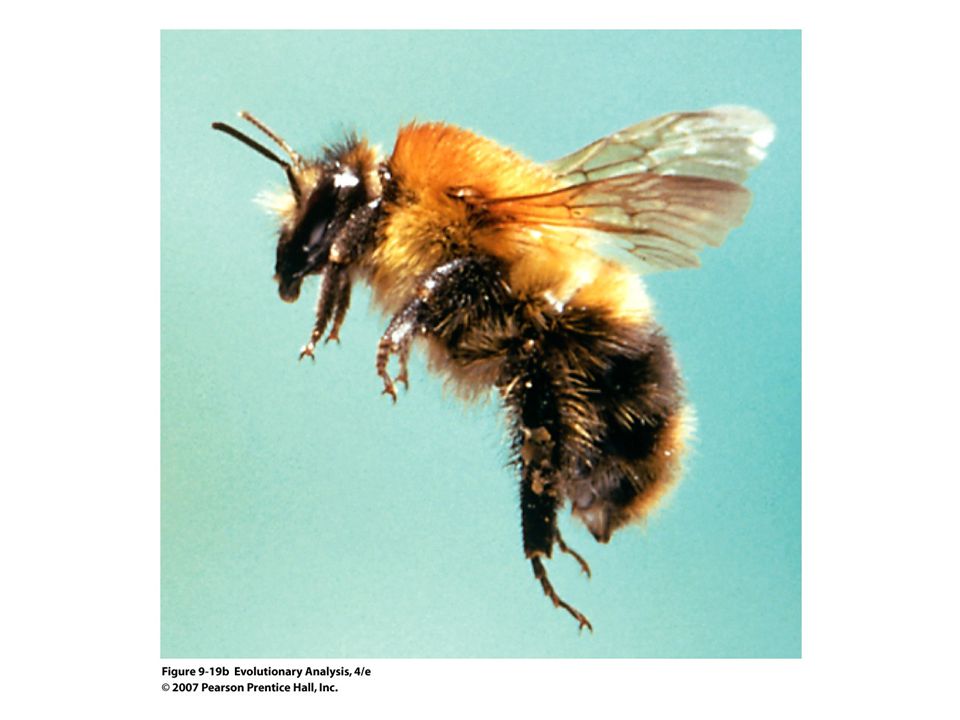
No filter Filtered image— “bumblevision”

13
Segregation Of floral types Demonstrate Genetic basis Of trait Differences

14
Convergent evolution??

15
Yosemite Sam thinks so

17
in the F2 generation

18
M C Q c M L Q L M C Q c x M L Q L If the map distance is 5 cm then there is a 95% chance that the marker will be associated with the QTL in the F2: 1- r(MQ)
")
19
M C1 Q c M C2 x If the map distance between markers and QTL are 5 cm then there is a 99.5% chance that one of the markers will be associated with the QTL in the F2: 1-2 r(M1Q)(QM2) M L1 Q L M L2 M C1 Q c M C2 M L1 Q L M L2 xx
(QM2) M L1 Q L M L2 M C1 Q c M C2 M L1 Q L M L2 xx")
22
1. Fisher’s prediction Mutation Effect Probability of Fixation 2. Kimura’s modification 3. Orr’s modification Theoretical models that support or contend with the Darwinian model Alleles with a distribution of effect sizes contribute to adaptations

23
III. Measuring Selection and Response to Selection on Continuous Traits

24
A. Heritability

25
Song sparrows Galapagos finches

26
Class Data Female Wt Female HT

27
Male Wt Male Ht

28
Heritability of Female Wt

31
Heritability of Female Ht

34
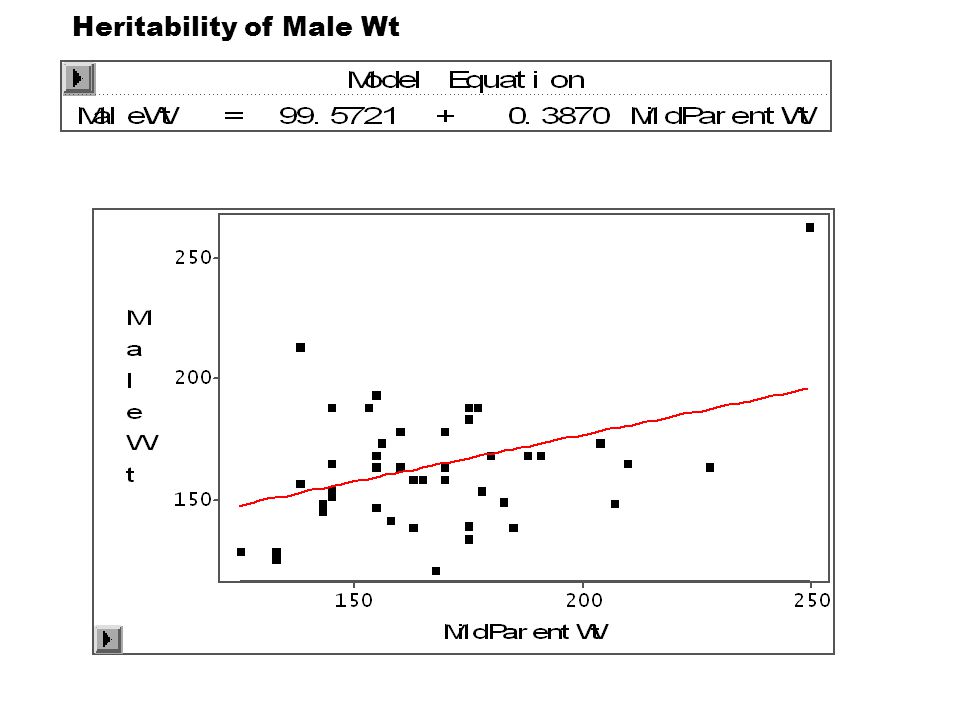
Heritability of Male Wt

37
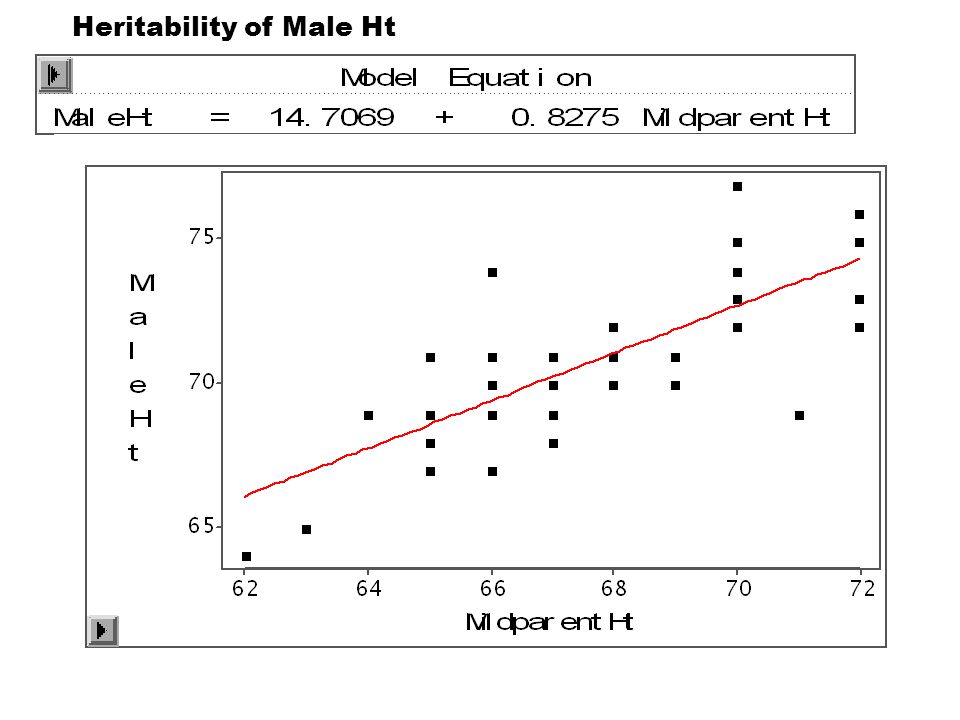
Heritability of Male Ht

40
Conclusions from class data: Distributions of Wts and Hts are roughly normal Distribution indicates that Wts and Hts are likely controlled by many loci, = many loci are segregating alleles that contribute to wt and ht differences among individuals Heritabilities for Ht >> WT 50% >> 30% Interpretation for other human traits??

41
Red Black

42
B. Selection Functional significance of trait variation S= S= t* - t t t*

43
C. Response to Selection The “2” term is meaningless, just an historical artifact of the derivation

47
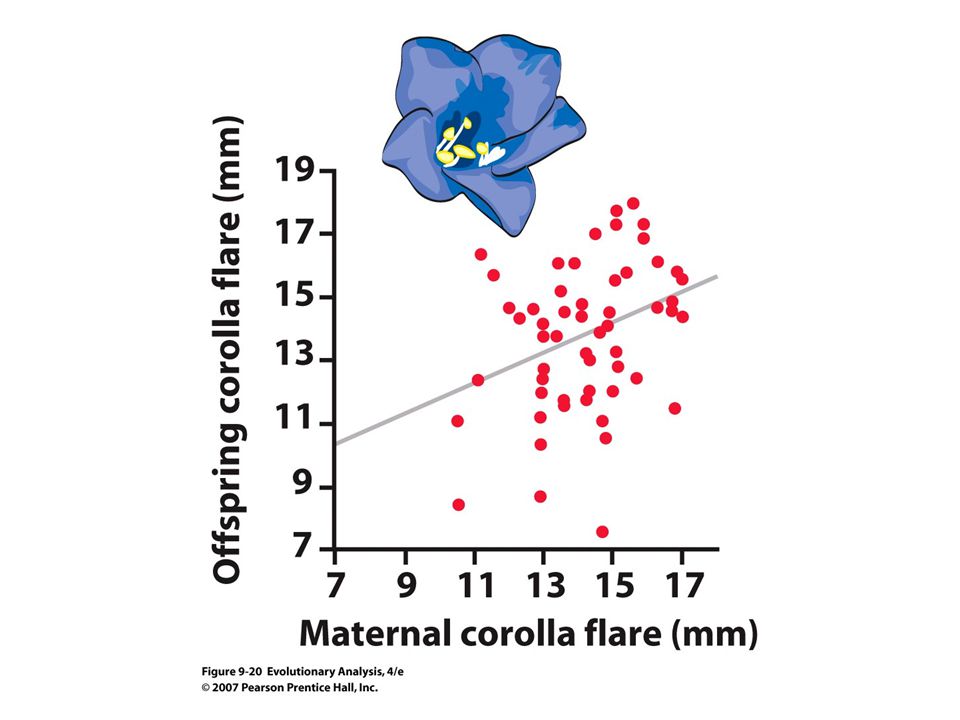
The slope of the best-fit line is 0.13

52
Stabilizing selection on a gall-making fly

53
Disruptive selection on bill size in the black-bellied seedcracker

54
Genetic by Environment Interaction

56
Low Altitude Site (Stanford)
")
57
High Altitude Site, Mather California

58
Conclusion Continuous traits are common Continuous traits can be heritable Continuous traits can respond to selection Darwin’s notion of natural selection acting on continuous variation is consistent with evidence Genetic x Environment interactions may be important

Similar presentations