Download presentation
Presentation is loading. Please wait.

1
Molecular Biomimetics Polypeptides to Inorganic structures

2
Biomimetics

3
Naturally derived nanostructures can be characterised as: Self directed in their organisation Operate in aqueous environment Dynamic interactions with their surroundings Complex structures and functions Self healing capabilities

4
Biomimetics Biological Hard tissues: Composite hybrid materials Inorganic phases Organic phases Excellent physical properties

5
Biomimetics Biocomposites: Structural macromolecules: Proteins Lipids Polysaccharides Minerals (hydroxyapatite, silica, magnetite, calcite)
")
6
Biomimetics Proteins: Recognition Binding Self assembly characteristics Inorganic surface-specific proteins: Couplers, growth initiatorsmodifiers, Self assembly of materials

7
Biomimetics Heterofunctional Nanostructure materials 1) Identification of Inorganic specific peptides – Design of Protein/peptide templates through directed evolution 2) Engineering of peptide building blocks – Tailoring recognition – Tailoring assembly properties – Leading to functional materials: Nanoparticles, polymers, molecular templates 3) Self and Coassembly into ordered structures
 Identification of Inorganic specific peptides – Design of Protein/peptide templates through directed evolution 2) Engineering of peptide building blocks – Tailoring recognition – Tailoring assembly properties – Leading to functional materials: Nanoparticles, polymers, molecular templates 3) Self and Coassembly into ordered structures")
8
Biomimetics

12
Basic Principle A binding molecule is bound to the sensor surface.(ligand –peptide, protein, sugar, oligonucleotide)) Another (the analyte) is passed over the surface and binds to it.
) Another (the analyte) is passed over the surface and binds to it.")
13
Experimental Design – Direct coupling of Ligand to Surface. – Membrane anchoring, where the interacting ligand is on the surface of a captured liposome. – Indirect, via a capture molecule (eg a specific IgG).
..")
14
Allows covalent coupling via -NH 2, -SH, and -CHO Allows covalent coupling via -NH 2, -SH, and -CHO Sensor Chip CM-5: Carboxymethylated dextran coated surface.

15
The Flow Cell F1 F2 F3 F4 F1 & 2 F3 & 4 F1 - 3 F1 - 4 Surface is divided into 4 channels, which can be used individually or in a number of combinations

16
Microfluidic System Low reagents consumption Efficient mass transport Low dispersion Highly reproducible injections; CV typically less than 1% Wide range of contact times, 1 s - 12 h Sample recovery and fractionation

17
Measurement of Binding Binding is measured as a change in the refractive index at the surface of the sensor This is due to ‘Surface Plasmon Resonance’ (SPR) The change in refractive index is essentially the same for a given mass concentration change (allows mass/concentration deductions to be made) Binding events are measured in real time (allowing separate on and off rates to be measured.)
 The change in refractive index is essentially the same for a given mass concentration change (allows mass/concentration deductions to be made) Binding events are measured in real time (allowing separate on and off rates to be measured.)")
18
Theoretical Considerations Binding is measured as a change in the refractive index at the surface of the sensor… How?

19
At a certain angle of incidence, light entering a prism is totally internally reflected. (TIR). Total Internal Reflection Although no photons exit the reflecting surface, their electric field extends ~1/4 wavelength beyond the surface.
. Total Internal Reflection Although no photons exit the reflecting surface, their electric field extends ~1/4 wavelength beyond the surface..")
20
Resonance Surface Plasmon If a thin gold film is placed on the reflecting surface, the photons can interact with free electrons in the gold surface. Under the right conditions, this causes the photons to be converted into plasmons and the light is no longer reflected.

21
Surface Plasmon Resonance This occurs when the light vector is equal to the surface plasmon vector….This occurs when the incident light vector is equal to the surface plasmon vector….

22
Plasmons create an electric field (evanescant) that extends into the medium surrounding the film This is affected by changes in the medium (eg binding of analyte), and results in a change in the velocity of the plasmons. This change in velocity alters the incident light vector required for SPR and minimum reflection. Effect of binding on SPR

23
How does BIACore Measure this? Fixed wavelength light, in a fan-shaped form, is directed at the sensor surface and binding events are detected as changes in the particular angle where SPR creates extinction of light.

24
The Sensorgram

25
Surface Plasmon Resonance Equilibrium, K D = k d / k a Association - k a Dissociation - k d time response buffer

26
Binding Analysis How Much? Active Concentration Kinetics Affinity Specificity How Fast? How Strong? How Specific?

27
Concentration Signal proportional to mass Same specific response for different proteins

28
What is QCM ?

29
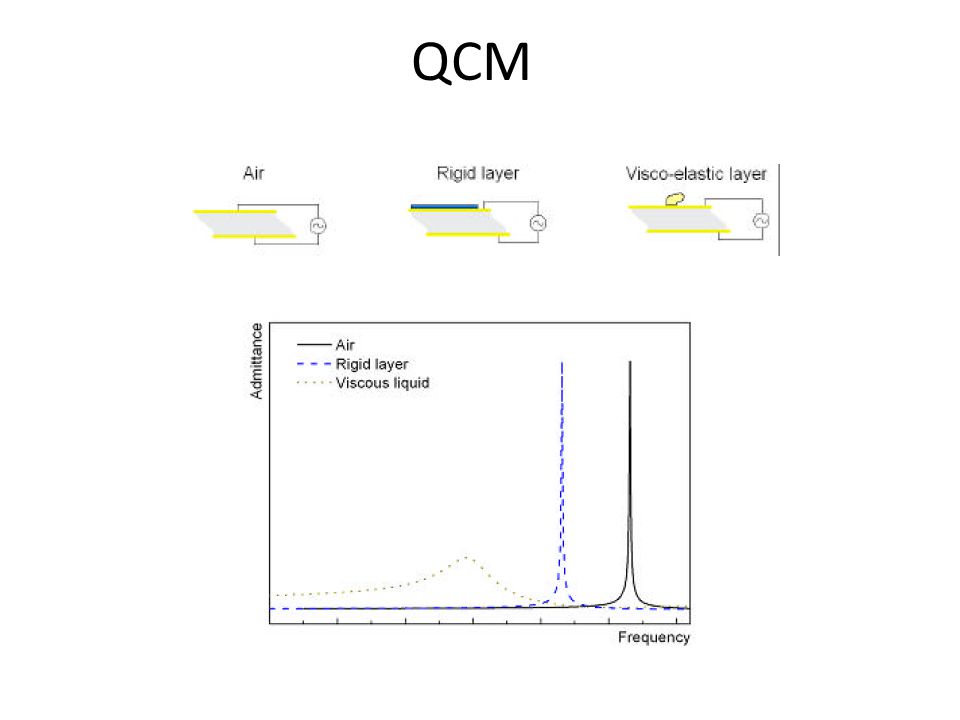
QCM

31
QCM- Measurement

32
QCM Measurement

35
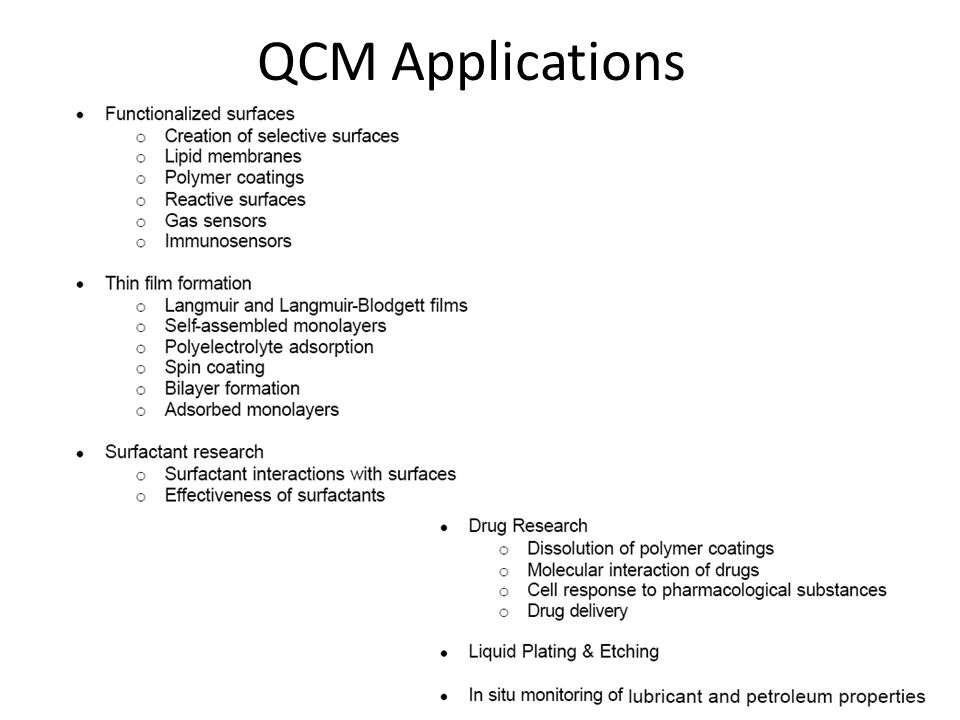
QCM Applications

37
Biomimetics

Similar presentations


 2.>")


 Propagate along the surface of a conductor Trapped on the surface because of their.>")
