Download presentation
Presentation is loading. Please wait.

1
I can plot coordinates. Given the equation of a straight line, I can complete a table of values. From a table of values, I can draw a straight line. Given a set of data, I can plot points on a scatter graph. I can draw a line of best fit. S3 BLOCK 8 Straight Line

2
Coordinates I can plot coordinates.

3
Review: Coordinates

4
Example 1 (a)Plot the points (1, 2) (2,3) (3,4) (4,5) and (5,6). (b)Draw a straight line through these points.
Draw a straight line through these points..")
5
Plot the points (1, 2) (2,3) (3,4) (4,5) (5,6)
 (2,3) (3,4) (4,5) (5,6)")
7
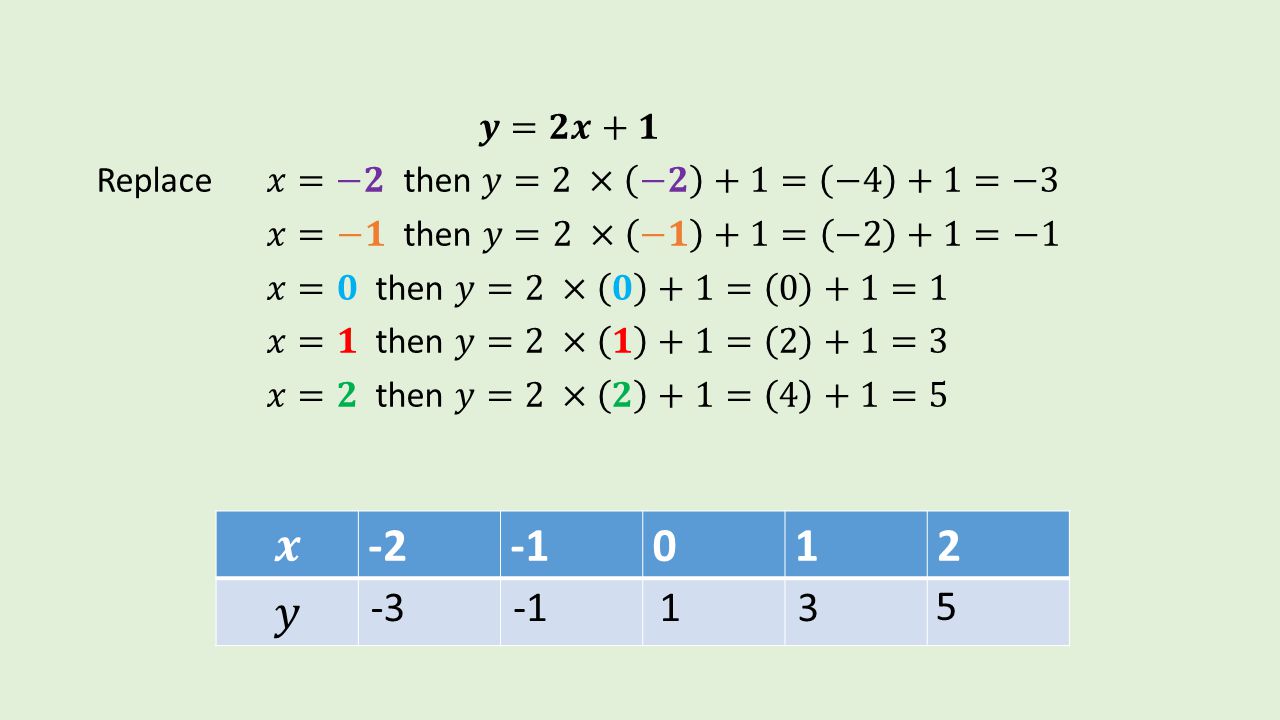
Table of values Given the equation of a straight line, I can complete a table of values. From a table of values, I can draw a straight line.

8
Table of values -2012

9
-2012 -313 5
10
Plot the points (-2, -3) (-1, -1) (0, 1) (1, 3) (2, 5) A straight line can be drawn through these points -2012 -313 5
 (-1, -1) (0, 1) (1, 3) (2, 5) A straight line can be drawn through these points")
11
Scatter graph Given a set of data, I can plot points on a scatter graph. I can draw a line of best fit.

12
Scatter graphs Scatter graphs are used to represent and compare two sets of data. By looking at a scatter diagram it is possible to say whether there is any connection (correlation) between the two sets of data.
 between the two sets of data..")
13
Line of Best Fit When there is a correlation between sets of data on a scatter graph, it is possible to draw a line of best fit. When drawing a line of best fit the aim is to keep the distance of all the points from the line to a minimum. Sometimes it is helpful to try to keep the number of points above the line as the same as the number of points below the line.

14
Example In a class 10 pupils tool a Science test and an Maths test. Their scores are listed in the table. (a)Illustrate this data with a scatter graph. (b)Draw a best fitting line on the graph PupilABCDEFGHIJ Maths Score2101549614191218 Science Score61218311814171020
Illustrate this data with a scatter graph. (b)Draw a best fitting line on the graph PupilABCDEFGHIJ Maths Score Science Score")
15
Science Score Maths Score 0 5 102015 0 5 10 15 20 H B C D E F G A I J

16
Science Score Maths Score 0 5 102015 0 5 10 15 20 H B C D E F G A I J

Similar presentations


 to solve problems. Approximate a line of best fit.>")


 between events. Scatter plots will often show.>")


 A(1,400) 4 minutes 2) B(3,300) 3) C(6,150)4) D(8,50) 5) Suppose that a line were drawn to connect.>")

, (2, 7), (4, 5), (6, 2), (10, 1) } a. Make a scatter plot b. Describe the correlation c. Write the equation of the line of best fit.>")
