Download presentation
Presentation is loading. Please wait.

2
Project Motivation & Description Accomplished Work Future Work

3
Coal-fired power plants provide 44.9 % of the electricity consumed in the USA. 847 billion tons of coal reserves worldwide will last around 119 years at current rates of production. Coal generates 25 % of global greenhouse gas emissions. CO2 makes up 77 % of global greenhouse gas emissions. http://www.worldcoal.org/coal, http://en.wikipedia.org/wiki/Coal_power_in_the_United_States

4
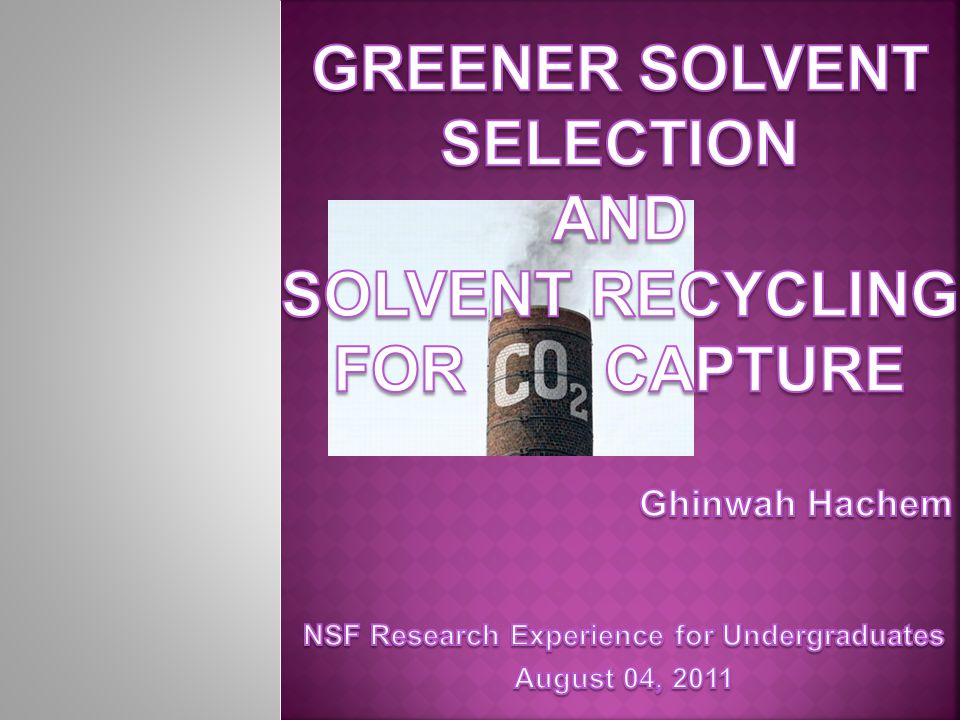
http://www.geos.ed.ac.uk/sccs/capture/, Integrated Framework for Solvent Selection and Solvent Recycling for CO 2 Capture: August 09 Monthly Report. EPRI, Palo Alto, CA. Product ID # 069040 Carbon Capture Systems: 1.Post-Combustion 2.Pre-Combustion 3.Oxy-Fuel Combustion Separation Techniques: 1.Physical Absorption 2.Chemical Absorption 3.Adsorption 4.Membrane Separation 5.Cryogenic Separation

5
Physical and chemical absorption, using amine solvents, for gases with low concentrations of CO2. CO2 stripping and solvent regeneration. High energy penalty: 20-40% of plant’s power output Folger, P. (2010). Carbon Capture: A Technology Assessment. Congressional Research Service, (p. 99)
. Carbon Capture: A Technology Assessment. Congressional Research Service, (p. 99).")
6
Using different solvents: Monoethanolamine (MEA) Diethanolamine (DEA) Amino Methyl Propanol (AMP) Solvents with solubility parameters similar to that of CO2 Varying design conditions Heights of columns Feed location Varying operating conditions Operating temperature Operating pressure Solvent flowrate http:// michelledagninosblog.blogspot.com /
 Diethanolamine (DEA) Amino Methyl Propanol (AMP) Solvents with solubility parameters similar to that of CO2 Varying design conditions Heights of columns Feed location Varying operating conditions Operating temperature Operating pressure Solvent flowrate michelledagninosblog.blogspot.com /")
7
Use a numerical optimization technique, Simulated Annealing (SA), to minimize the energy consumed by the carbon capture process. Diwekar, U. Introduction to Applied Optimization 2nd Edition. Clarendon Hills: Springer. Model: Simulation developed in Aspen Plus Decision Variables: Model Parameters Objective Function: Energy Constraints: mass and energy balance, reaction kinetics

8
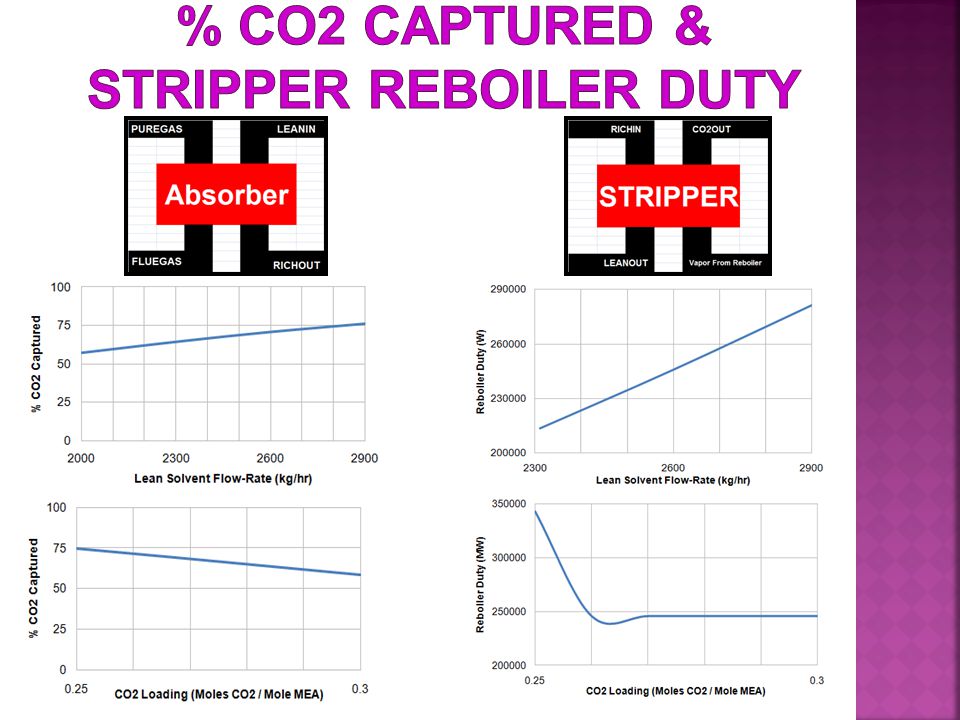
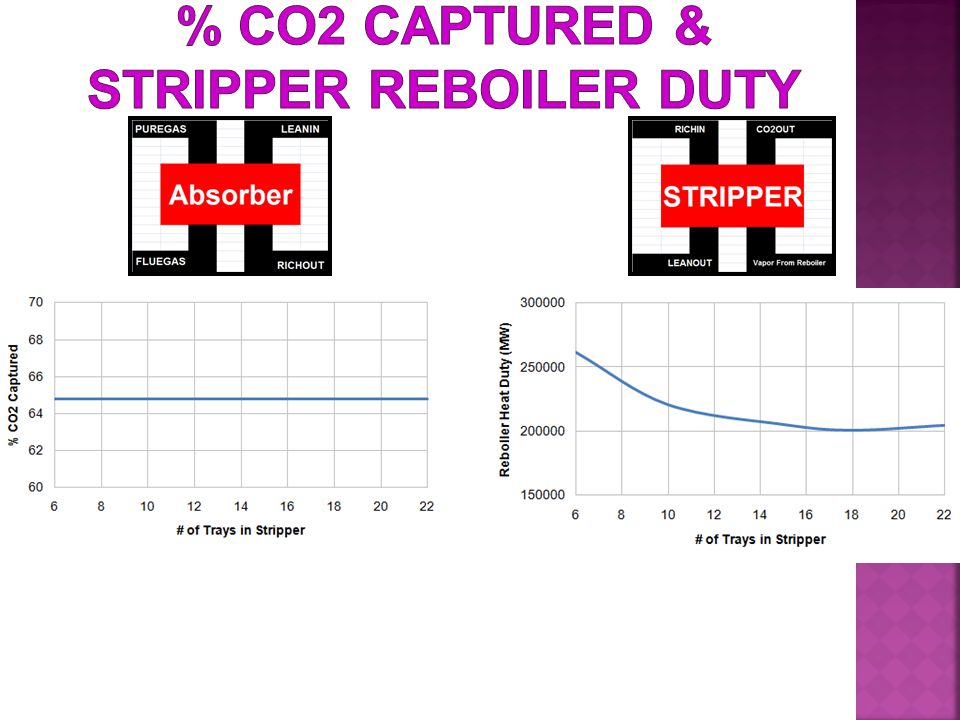
Solvent = 30 weight percent MEA solution Rate-based model NOT Equilibrium Model Perform Parametric Studies

12
Possible combinations: Where: 100 5 = 100 samples of each of the 5 continuous variables N a = Maximum number of trays in absorber N s = Maximum number of trays in stripper N a ! = Possible absorber feed tray locations N s ! = Possible stripper feed tray locations Use simulated annealing, a numerical optimization method, to minimize the energy penalty.

13
Read “Introduction to Applied Optimization” Use SA to solve an example problem in Aspen Plus 1.Understand what Simulated Annealing (SA) is 2.Become Familiar with the CAPE-OPEN SA Capability in Aspen Plus
 is 2.Become Familiar with the CAPE-OPEN SA Capability in Aspen Plus")
14
Global optimization technique that: Mimics physical annealing: Heating and controlled cooling of a material which allows atoms to find configurations with lower internal energy compared to their initial configurations. High Temperature Low Temperature http://on.wikipedia.org/wiki/Simulated-Annealing, Diwekar, U. Introduction to Applied Optimization 2nd Edition. Clarendon Hills: Springer.

15
Goal: Minimize Objective Function Multiply by (-) to maximize Specify: Binary variables AND discrete variables Discretize continuous variables Equality constraints AND inequality constraints Initial temperature Freezing temperature Temperature decrement Simple rule: T new = α T old where 0.8≤ α ≤0.99 Temperature is a parameter
 to maximize Specify: Binary variables AND discrete variables Discretize continuous variables Equality constraints AND inequality constraints Initial temperature Freezing temperature Temperature decrement Simple rule: T new = α T old where 0.8≤ α ≤0.99 Temperature is a parameter")
16
Maintain constant temperature by: Varying oxygen flow-rate between 5000 and 10000 kmol / hr Maximizing water flow-rate (-water flow-rate = cost) Oxygen kmol / hrWater kmol / hr OXYGEN FLOW-RATE: 5800 kmol / hr
 Oxygen kmol / hrWater kmol / hr OXYGEN FLOW-RATE: 5800 kmol / hr")
17
Continuous Variables Stripper reflux ratio : optimum at 0.017 LEAN-IN Pressure : optimum at 1.05 atm RICH-IN Pressure : optimum at 1.07 atm LEAN-IN Temperature: optimum at 42.28 ⁰ C Moles CO 2 / Mole MEA: optimum at 0.25 Integer Variables Stripper feed stage: optimum at stage 6

18
Understood performance of MEA rate based system 1. Parametric studies 2. Simulated annealing Perform parametric studies and simulated annealing on: 1. DEA system 2. MEA+DEA system 3. New Solvent http://4photos.net/en/image:111-195616-save_energy_pictures_images

19
National Science Foundation EEC-NSF Grant # 1062943 Dr. Urmila Diwekar Dr. Juan Salazar Dr. Christos Takoudis Dr. Greg Jursich

Similar presentations


 IGCC is basically the combination of the gasification unit and the combined cycle. It has high efficiency.>")


