Download presentation
Presentation is loading. Please wait.

1
Preliminary Results from ATDD’s Soil Moisture/Temperature Testbed Soil Moisture and Soil Temperature Observations and Applications: A Joint U.S. Climate Reference Network (USCRN) – National Integrated Drought Information System (NIDIS) Workshop, Oak Ridge, TN, March 3-5, 2009 William Collins wgamcollins@earthlink.net USCRN
 – National Integrated Drought Information System (NIDIS) Workshop, Oak Ridge, TN, March 3-5, 2009 William Collins USCRN.")
2
Characteristics of Oak Ridge Data From 2000 day 172 of 2007 through 0900 day 100 of 2008 Instrument Deployment— 4 holes with temperature and moisture sensors: 3 at 5 cm depth 3 at 10 cm depth 2 at 20 cm depth 1 at 50 cm depth 1 at 100 cm depth The moisture sensors are Vitel moisture instruments, measuring the dielectric constant to get water content. The water content is given in m 3 water/m 3.

3
Study Objective This study will exclusively examine the characteristics of the soil moisture and temperature data at 5 and 10 cm since only those 2 depths have 3 sensors. The use of 3 sensors at the same location has proven invaluable in the quality control of temperature and precipitation (from the 3-wire Geonor gauges) for the U. S. Climate Reference Network. This study will take a first look at that utility here.
 for the U. S. Climate Reference Network. This study will take a first look at that utility here..")
4
Statistics for Full Time Period by Individual Hole and Depth: Mean Temperature by Sensor Inter-sensor Temperature Differences Distributions (0.2 C bins) Means Standard Deviations (Only a few typical examples are shown.)
 Means Standard Deviations (Only a few typical examples are shown.)")
5
Mean: T1: 16.27 T2: 16.35 T3: 16.42

6
Mean: Std Dev: T2-T1: -0.083 T2-T1: 0.212 T3-T1: -0.260 T3-T1: 1.038 T3-T2: -0.177 T3-T2: 0.875 Mean: T1: 16.51 T2: 16.42 T3: 16.25

7
Mean: Std Dev: T2-T1: -0.216 T2-T1: 0.671 T3-T1: -0.296 T3-T1: 0.840 T3-T2: -0.079 T3-T2: 0.648 Mean: T1: 16.67 T2: 16.46 T3: 16.38

8
Mean: M1: 0.143 M2: 0.155 M3: 0.125

9
Mean: Std Dev: M2-M1: 0.046 M2-M1: 0.012 M3-M1: -0.001 M3-M1: 0.020 M3-M2: -0.047 M3-M2: 0.012 Mean: M1: 0.088 M2: 0.134 M3: 0.087

10
Mean: Std Dev: M2-M1: -0.032 M2-M1: 0.041 M3-M1: -0.062 M3-M1: 0.049 M3-M2: -0.029 M3-M2: 0.046 Mean: M1: 0.187 M2: 0.155 M3: 0.126

11
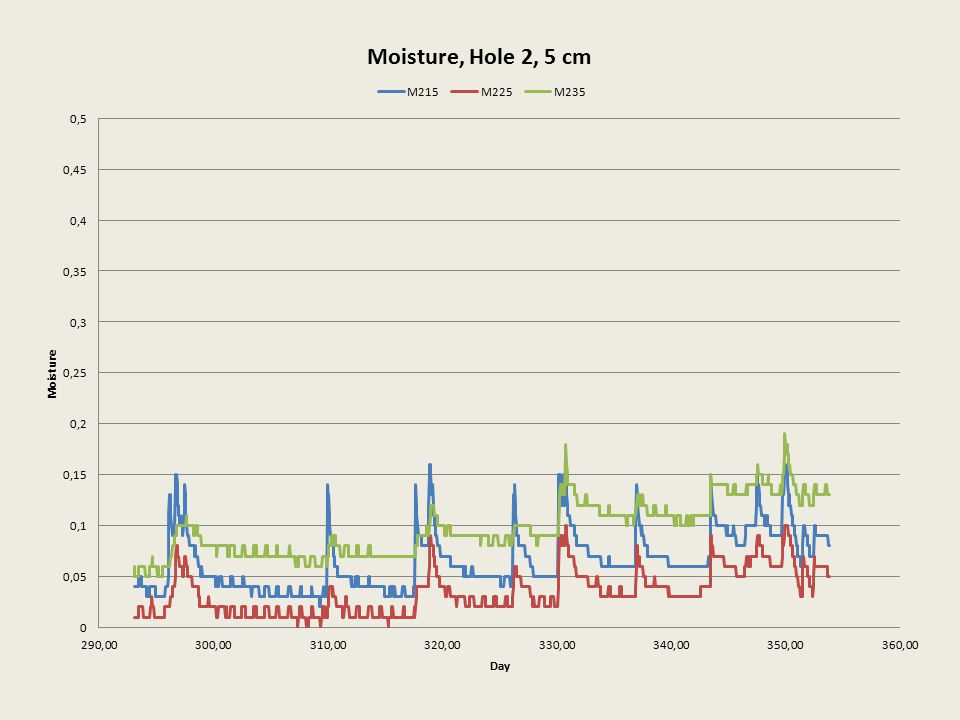
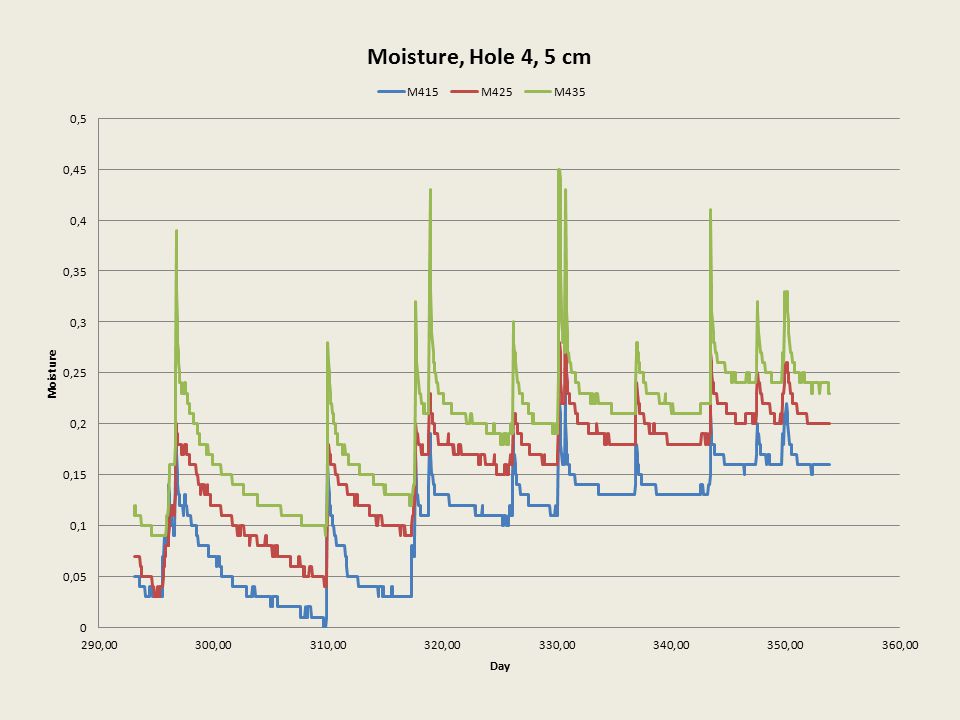
Comparison of Moisture for 3 Co-located Sensors The moisture during the period of record begins dry and ends wet. The data were divided as follows: Dry period: 2000 day 172 2007 to 2400 day 295 2007 Wet period: 0100 day 329 2007 to 0900 day 100 2008 Transition period: data in between The following plots show a comparison of the moisture at 5 and 10 cm depth, individually for each sensor and hole for a selected time period spanning dry to wet.

12
Note! Same vertical scale used for all these plots.

20
Comparison of Average Moisture At 4 Holes Individually at 5 and 10 cm Depth Selected Time Period (Dry to Wet) Note! Without quality control, the best estimate of the moisture should be the average of the 3 sensor values. The following plots have the 3 sensor values averaged, and in addition, they are smoothed in time with values (0.25, 0.50, 0.25).
..")
23
Examples of Large Inter-Sensor Differences Lower Limits for Example Choices (8 : Moisture (m 3 water/m 3 soil): 5 cm – 0.192 10 cm – 0.184 Temperature (C): 5 cm – 6.10 10 cm – 5.44
: 5 cm – cm – Temperature (C): 5 cm – cm – 5.44")
24
yeardaytimehole depth (cm)T1T2T3 200727514003529.7529.3236.09 Large Temperature Difference (Dry)
T1T2T Large Temperature Difference (Dry)")
25
yeardaytimehole depth (cm)T1T2T3 200730715004519.2824.3518.1 Large Temperature Difference (Transition)
T1T2T Large Temperature Difference (Transition)")
26
yeardaytimehole depth (cm)T1T2T3 200821140045-0.526.480.55 Large Temperature Difference (Wet)
T1T2T Large Temperature Difference (Wet)")
27
yeardaytimesensor depth (cm)m1m2m3 20071911900350.050.280.18 Large Moisture Difference (Dry)
m1m2m Large Moisture Difference (Dry)")
28
yeardaytimesensor depth (cm)m1m2m3 200731823004100.280.210.4 Large Moisture Difference (Transition)
m1m2m Large Moisture Difference (Transition)")
29
yeardaytimesensor depth (cm)m1m2m3 200736211004100.280.230.44 Large Moisture Difference (Wet)
m1m2m Large Moisture Difference (Wet)")
30
Comparison of Mean Moisture for Dry and Wet Periods For the Same Sensor

31
Line has slope 1:1 Best response would be alone line of slope 1:1, with vertical displacement and sensors from same hole grouped together.

33
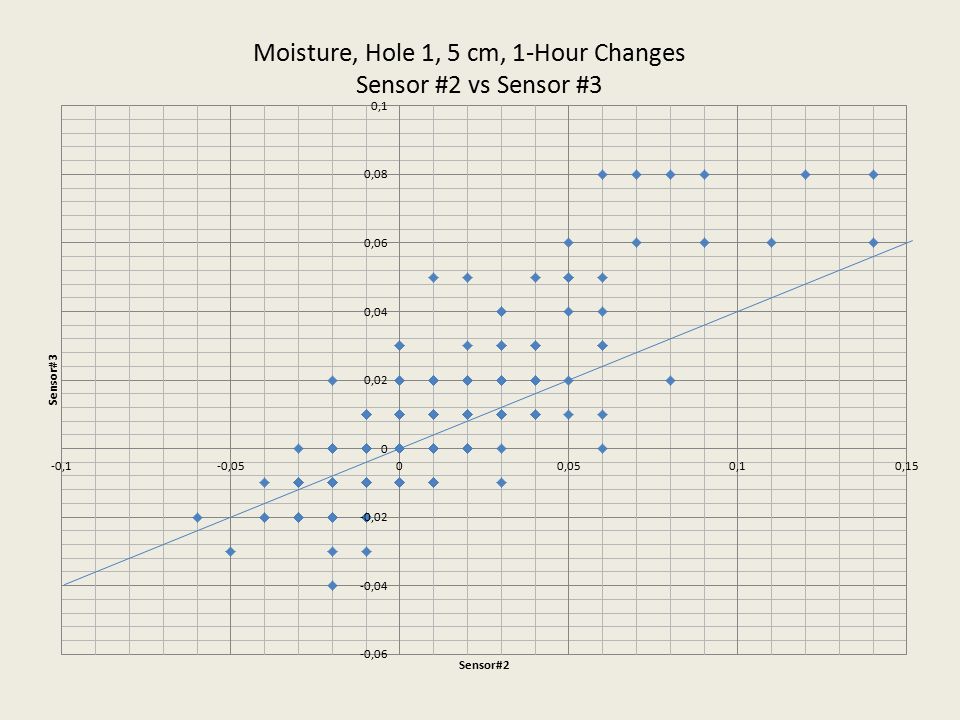
Comparison of 1-Hour Changes in Moisture Between Pairs of Sensors at Hole 1 Full Time Record Possible use in quality control…

34
Line is not linear fit; has 1:1 slope. Ideal fit would be along this line.

35
Line is not linear fit; has 1:1 slope.

40
Comparison of Moisture Standard Deviations— Inter-sensor differences versus Inter-sensor 1-hour change differences Individually for Dry and Wet Periods Implications for Quality Control

41
Since the inter-sensor standard deviation for 1-hour change becomes smaller as the inter-sensor standard deviation becomes smaller, the inter-sensor 1-hour change provides independent information for the quality control of soil moisture.

43
Steeper slope of line for wet period indicates even greater value of 1-hour change for quality control than for dry period.

45
Summary Preliminary comparison was made between the 3 co-located soil temperature and moisture sensors from nearly 300 days of data from four holes at Oak Ridge, TN. The inter-sensor differences show wide differences in the performance of individual sensors. Also, there are significant differences between the mean values of moisture at the 4 holes at 5 and 10 cm depths. The results have implications for quality control for both temperature and moisture— The use of 3 sensors is invaluable for error and value determination. Sensor value and change in time are both useful for qc. Individual sensor characteristics, if developed, might be valuable. Question for research: Can differences in individual sensor characteristics be linked to calibration, installation, or other factors?

Similar presentations


 Surface Meteorological Stations and Data Quality Control Procedures.>")
 – National Integrated Drought Information.>")


 Precipitation ERS 482/682 Small Watershed Hydrology.>")


