Download presentation
Presentation is loading. Please wait.

1
2-D and 3-D Coordinates For M-Mers And Dynamic Graphics For Representing Associated Statistics By Daniel B. Carr dcarr@gmu.edu George Mason University

2
Overview Background Encoding and self-similar coordinates Examples Rendering software – GLISTEN Closing remarks

3
Background Task – Visualize statistics indexed by a sequence of letters Letter-Indexing –Nucleotides: AAGTAC –Amino Acids: KTLPLCVTL –Terminology: blocks of m letters called m-mers Statistics: counts or likelihoods for –Short DNA sequence motifs for transcription factor binding: gene regulation –Peptide docking on immune system molecules

4
Graphical Design Goals Provide an overview and selective focus Use geometric structures to –Organize statistics –Reveal patterns –Provide cognitive accessibility Incorporate scientific knowledge in layout choices –Enhance patterns and simplify comparisons

5
Common Practice - Tables Published tables – a linear list –Sorted by values of a statistic –Indexing letter sequences shown as row labels –Only few items shown of thousands to millions

6
Common Practice - Graphics 1-D histograms – some examples –Nucleotides: Distribution of promoters by distance upstream from the start codon –Amino acids: Sequence alignment logo plots are one variant Docking counts by position Cell-colored matrices? –More commonly used for microarray data and correlation matrices

8
Graphical Encoding Ideas: Use Points For M-Mers Represent m-mers using coordinates –A point stands for an m-mer –A glyph at the point represents statistics for that m-mer. For example point color, size, shape Challenge –The domain of all letter sequences is exponential in sequence length – Display space is limited

9
Self-Similar Coordinates Self-similarity helps us keep oriented –Parallel coordinate plots are increasingly familiar Coordinates from 3-D geometry –4 Nucleotides => tetrahedron –20 Amino acids Icosahedron face centers Familiar coordinates => hemisphere Two kinds of self-similarity –At different scales => fractals –At the same scale => shells, surfaces

10
Self-Similarity At Different Scales: Nucleotide Example Represent each 6-mer as a 3-D point –(4 nucleotides) 6 = 4096 points Attractor: tetrahedron vertices –A=(1,1,1), C=(1,-1,-1), G=(-1,1,-1), T=(-1,-1,1) Computation: –Hexamer position weights: 2^(5,4,3,2,1,0)/63 –ACGTTC -> (.555,.270,.206)
 6 = 4096 points Attractor: tetrahedron vertices –A=(1,1,1), C=(1,-1,-1), G=(-1,1,-1), T=(-1,-1,1) Computation: –Hexamer position weights: 2^(5,4,3,2,1,0)/63 –ACGTTC -> (.555,.270,.206)")
11
Application: Gene Regulation Studies Cluster genes based on –Gene expression levels in different situations –Other criteria such as gene family For each cluster look in gene regulation regions for recurrent nucleotide patterns –Over expressed m-mers: potential transcription factor docking sites Show frequencies (or multinomial likelihoods)
")
12
Sliding hexamer window 300 letters upstream from open reading frames –300ATATGA –299TATGAG –298ATGAGT –297TGAGTA Nucleotides Example Yeast Gene Regulation 29 Genes in a cluster –YBL072c –YDL130w –YDR025w – … –YCL054w

13
Statistics Number of genes with hexamer –TTTTTC 22 –GAAAAA 21 –TTTTTT 19 –AAAAAT 19 –TTTTCA 18 –ATTTTT 17 Total number of appearances, etc.

17
Extensions 2-D version (projected gasket) – 10mers => 1024 x 1024 pixel display Wild card and dimer counts –TACC……GGAA Include more scientific knowledge –Special representations for known transcription factors More interactivity –Filtering for regions upstream –Mouseovers, etc.
 – 10mers => 1024 x 1024 pixel display Wild card and dimer counts –TACC……GGAA Include more scientific knowledge –Special representations for known transcription factors More interactivity –Filtering for regions upstream –Mouseovers, etc.")
18
Self-Similarity At Different Scales: Amino Acids Sequence Coordinates Represent each 3-mer as a 3-D point – (20 amino acids) 3 = 8000 points Attractor: icosahedron face centers –Let x1=.539, x2=.873, x3=1.412 –A=(x1,x3,0), C=(0,x1,x3), … Y=(-x3,0,-x1) Computation Position weights: 3.8 (2,1,0) scaled to sum to 1. Letters HIT => (-1.26, -1.08,.180)
.")
19
Graphical Encoding Ideas: Paths Use paths connecting m-mer points to represent longer sequences –Path features, thickness and color can encode statistics indexed by the concatenated m-mers –Can reuse the m-mers keeping a common framework –3 3-mers -> two segment path -> 9 mer Challenges –Overplotting, path ambiguity, prime sequence lengths –Using translucent triangles for triples is poor, etc.

20
Letter x Position Coordinates And Paths Merits –Few points and simple structure 20 amino acids by 9 positions = 180 points Challenges –Path overplotting =>filtering –Avoiding path interpretation ambiguity in higher dimensional tables => 3-D layouts

21
Self-Similarity At The Same Scale: Amino Acids Coordinates Each point represents a letter and position pair – 9-mers: 20 letter x 9 positions = 180 points Geometry: icosahedron face centers –Let x1=.539, x2=.873, x3=1.412 –A=(x1,x3,0), C=(0,x1,x3), … Y=(-x3,0,-x1) Use scale factor for a given position –Scale factors for 9-mers: 2.2, 2.4, 2.6, …, 3.6 –A1 => 2.2*(x1,x3,0) C2=>2.4*(0,x1,x3) Problem: overplotting of paths
, C=(0,x1,x3), … Y=(-x3,0,-x1) Use scale factor for a given position –Scale factors for 9-mers: 2.2, 2.4, 2.6, …, 3.6 –A1 => 2.2*(x1,x3,0) C2=>2.4*(0,x1,x3) Problem: overplotting of paths")
22
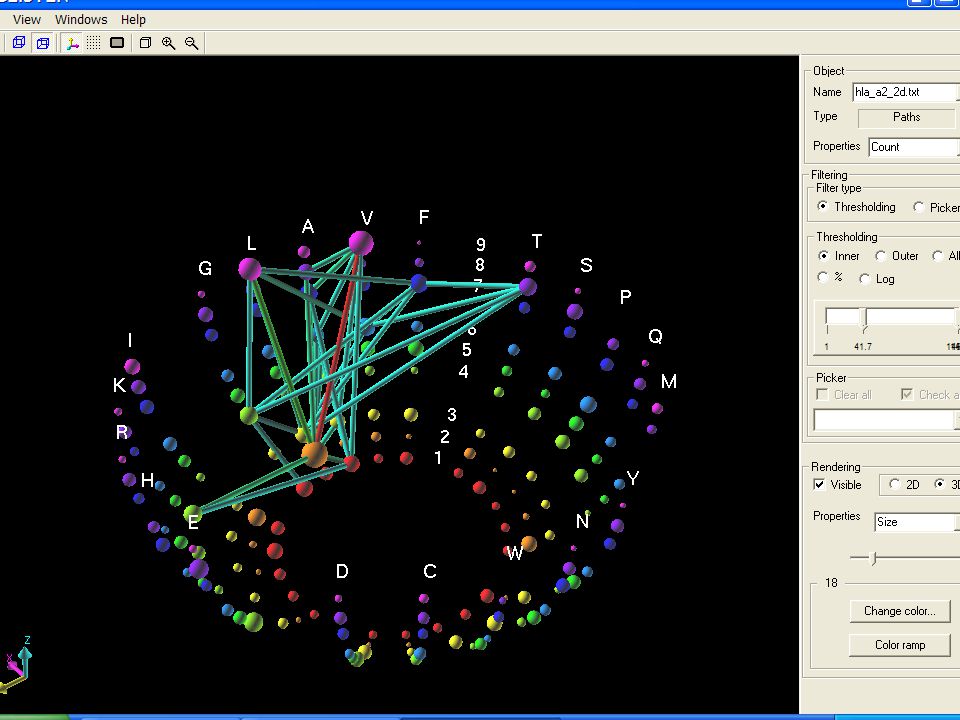
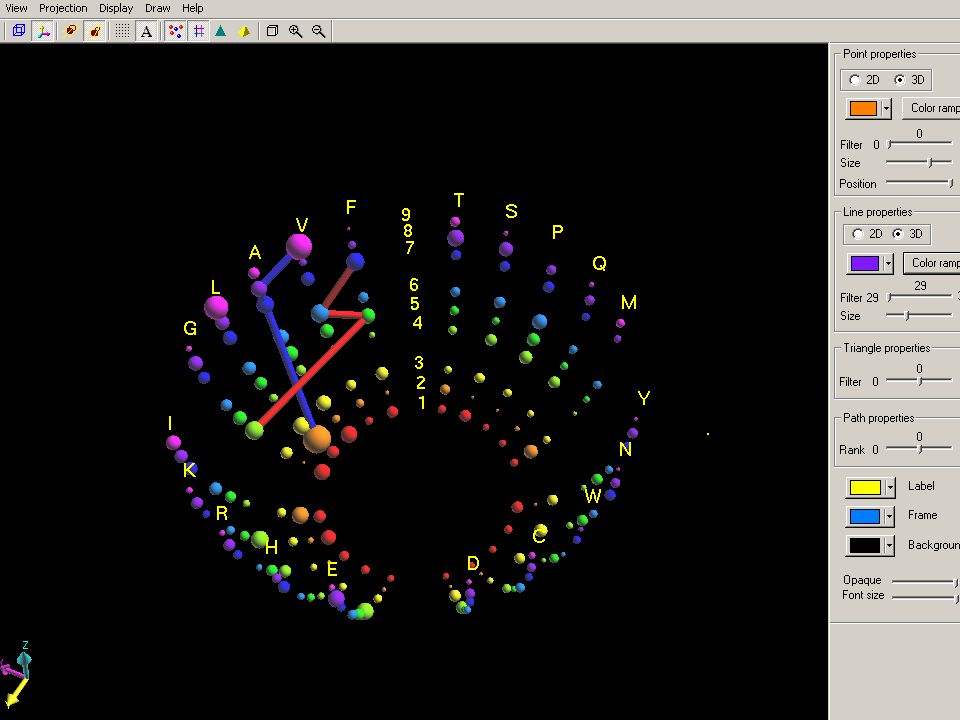
Self-Similarity At The Same Scale: Amino Acids Example Each point represents a letter and position pair – 9-mers: 20 letter x 9 positions = 180 points Geometry: hemisphere –Amino acid: longitude, Position: latitude –Amino acid ordering Group by chemical properties: hydrophobic, etc. Order to minimize path length in given application –Include gaps for perceptual grouping Path overplotting still a problem, need filtering

23
Peptide Docking Example Immune system molecules combine with peptides to form a complex recognized by T-cell receptors –Problems: Failure to dock foreign peptides Docking with “self” peptides Molecule specific databases of docking peptides –MHCPEP 1997, Brusic, Rudy, and Harrison –Human leukocyte antigen (HLA) A2, class 1 molecule Small: about 500 peptides of 20 9 = ½ trillion possibilities Mostly 9-mers (483) Positions related to asymmetric docking groove
 A2, class 1 molecule Small: about 500 peptides of 20 9 = ½ trillion possibilities Mostly 9-mers (483) Positions related to asymmetric docking groove")
24
Peptide Docking Interests Which amino acids appear in which position? Characterize the space of docking, not-docking, unknown Prediction of unknowns Focused questions Is there a docking peptide in a key protein common to all 23 HIV strains?

25
Number of the 483 peptides with the amino acid in position 2 M Q P S T F V A L G I K R H E D C W N Y 45 4 1 1 23 2 16 14 294 1 71 5 2 0 2 1 1 0 0 1 Cells from the collection of all 4-position tables: 126 tables of potentially 20 4 = 160000 cells each G4 F5 V6 F7: 35 L2 A7 A8 V9: 29 … Docking Statistics

28
Graphics Software GLISTEN –Geometric Letter-Indexed Statistical Table Encoding –Swap out coordinates at will with tables unchanged –NSF research: second generation version in progress Available partial alternatives –CrystalVision ftp://www.galaxy.gmu.edu/pub/software/ftp://www.galaxy.gmu.edu/pub/software/ –Ggobi www.ggobi.org/download.html

29
Hemisphere Plot Versus Parallel Coordinate Plots PC plots are –Better for the many scientists preferring flatland –Straight forward to publish –Ambiguous when connecting non-adjacent axes Hemisphere plots –3-D curvature reduces line ambiguity and provides a general framework for tables involving non-adjacent positions –3-D provides more neighbor options to group amino acids based on chemical properties: non-polar, etc.

30
Closing Remarks Docking applications are still evolving –New procedures for inference and better databases Graphics still need work –More scientific structure –Work on cognitive optimization GLISTEN can address many other applications

31
Graphics Reference Lee, et al. 2002, “The Next Frontier for Bio- an Cheminformatics Visualization,” IEEE Computer Graphics and Applications, Sept/Oct pp,. 6-11.

32
Relate Scientific References (1) Spellmen, et al. 1998. “Comprehensive Identification of Cell Cycle-regulated Gened of the Yeast Saccharomyces cervisiae by Microarray Hybridization,” Molecular Biology of the Cell. Vol 9, pp. 3273-3297. Keles, van der Laan, and Eisen. 2002. “Identification of regulatory elements using a feature selection method.” Bioinformatics, Vol. 18. No 9. pp1167-1175.

33
Related Scientific References (2) Segal Cummings and Hubbard. 2001. “Relating Amino Acid Sequences to Phenotypes: Analysis of Peptide-Binding Data,” Biometrics 57, pp. 632-643.

Similar presentations


 The Mechanics of Alignments.>")
