Download presentation
Presentation is loading. Please wait.

1
Scenario building in climate science Hans von Storch Institute for Coastal Research GKSS Research Center U Lüneburg, 1.6.2006

2
Küstenforschung GKSS, Geesthacht Beschreibung und Bewertung von gegenwärtigem Kima und Kimawandel im Küstenraum. Ableitung von Szenarien des möglichen zukünftigen Klimawandels im Küstenraum. Besonderes Augenmerk: Windbezogene Aspekte, also Windkraft, Sturmfluten und Seegang. Vor allem: Nord- und Ostsee.

3
Rekonstruktion vergangener und gegenwärtiger Zustände und deren Änderung PKMnP Zukünfte = plausible, konsistente, mögliche aber nicht notwendigerweise wahrscheinliche Zukünfte = Szenarios.

4
Outline What is a scenario? Scenarios of what? – anthropogenic climate change Critical assumption for building scenarios – emission of radiatively active substances into the atmosphere Tools to construct climate change scenarios: quasi-realistic climate models Tools for considering adaptation options: regional models, impact models

5
What is a scenario? A scenario is a consistent, plausible description of a possible not necessarily probable future. It often takes the form of a conditional prediction, i.e., a prediction which utilizes assumptions about a few critical, often intrinsically unpredictable developments. When all conditional predictions agree, it is an unconditional prediction (i.e., there will be a warming)
.")
6
What is a scenario good for? Scenarios allow for the exploration of the availability of options and the usefulness of actions. Scenarios help to identify developments which should be avoided or aimed at. Ideally, a series of different, partially inconsistent scenarios is constructed so that the full space of options can be explored. Scenario open minds for unexpected developments (which sometimes scare people).
..")
7
Scenarios of what? Climate = the statistics of weather, usually described by probability density functions, in particular by - their moments (e.g., mean, std deviation, covariances), - percentiles and return values, - spatial characteristics (e.g., EOFs), - temporal characteritsics (autocovariacne function, spectra)
, - percentiles and return values, - spatial characteristics (e.g., EOFs), - temporal characteritsics (autocovariacne function, spectra).")
8
Scenario building Construction of scenarios of emissions. Construction of scenarios of concentrations of radiatively active substances in the atmosphere. (Ok – not quite exact; aerosols …) Simulation of climate as constrained by presence of radiatively active substances in the atmosphere (“prediction” of conditional statistics).
 Simulation of climate as constrained by presence of radiatively active substances in the atmosphere ( prediction of conditional statistics)..")
9
Scenario building 1.Simulation with global models, which describe several compartments of the global earth system – relatively coarse spatial grid resolution (e.g., 200 km) 2.Simulation with regional models, often with only one or a few compartments (mostly atmosphere) – relatively high spatial grid resolution (e.g., 50 km) 3.Simulation with impact models – a large varitey of different systems, e.g., storm surges or ocean waves.
 2.Simulation with regional models, often with only one or a few compartments (mostly atmosphere) – relatively high spatial grid resolution (e.g., 50 km) 3.Simulation with impact models – a large varitey of different systems, e.g., storm surges or ocean waves.")
10
“SRES” Scenarios SRES = IPCC Special Report on Emissions Scenarios A world of rapid economic growth and rapid introduction of new and more efficient technology. A very heterogeneous world with an emphasis on family values and local traditions. A world of “dematerialization” and introduction of clean technologies. A world with an emphasis on local solutions to economic and environmental sustainability. “ business as usual ” scenario (1992). A1 A2 B1 B2 IS92a IPCC, 2001
. A1 A2 B1 B2 IS92a IPCC,")
11
4CO2 3CO2 2CO2 SRES scenarios

12
Components of the climate system. (Hasselmann, 1995)
")
13
Are 20 proxies enough to reconstruct the global mean temperature? Do temperature and precipitation proxies yield the same NAO reconstruction? Quasi-realistic climate models … … are dynamical models, featuring discretized equations of the type with state variables Ψ k and processes P i,k. The state variables are typically temperature of the air or the ocean, salinity and humidity, wind and current. … because of the limited resolution, the equations are not closed but must be closed by “parameterizations”, which represent educated estimates of the expected effect of non-described processes on the resolved dynamics, conditioned by the resolved state.

14
atmosphere

15
ocean

18
Global scenarios of the air temperature change (in K) at the end of the 21st century, as determined with a global climate model forced with A2 and B2 emissions. Courtesy: Danmarks Meteorologiske Institut.

19
Typical different atmospheric model grid resolutions with corresponding land masks. T42 used in global models. (courtesy: Ole Bøssing- Christensen)
.")
20
Agreement among 7 out of a total of 9 simulations TAR (2001) „regional development“ scenarios A2 and B2. temperature Giorgi et al., 2001

21
Agreement among 7 out of a total of 9 simulations precipitation TAR (2001) „regional development“ scenarios A2 and B2. Giorgi et al., 2001

22
Regional atmospheric modelling: nesting into a global state

23
Typical different atmospheric model grid resolutions with corresponding land masks. 50 km grid used in regional models (courtesy: Ole Bøssing- Christensen)
.")
24
Temperature change (in K) for winter (DJF) between the periods 1961-1990 and 2071-2100 according to the SRES A2 scenario.
 for winter (DJF) between the periods and according to the SRES A2 scenario.")
25
RCAOHIRHAM CLM REMO5 A2 - CTL: changes in 99 %-iles of wind speed (6 hourly, DJF): west wind sector selected (247.5 to 292.5 deg) Woth, pers.comm.
: west wind sector selected (247.5 to deg) Woth, pers.comm.")
26
Estimated changes according to IPCC cenario A2 in 2070- 2100 relative to 1960-1990; CLM model (Rockel, per. comm.)
.")
27
dynamical downscaling of water level / North European shelf sea SLP & wind components GCM (CTL: 1961 - 1990) (A2: 2071 - 2100) series of RCM runs Run of the TRIM surge-model with a series of RCM forcing Woth, pers.comm.
 (A2: ) series of RCM runs Run of the TRIM surge-model with a series of RCM forcing Woth, pers.comm.")
28
Projections for the future / surge meteorological forcing: HIRHAM / RCA Differences in inter-annual percentiles of surge / A2 - CTL: HIRHAM Differences in inter-annual percentiles of surge / A2 - CTL: RCA Woth, pers.comm.

29
“Localisation”: From the coast into the estuary St Pauli 2030 2085

30
Grid box “Cuxhaven” Empirical transfer- function: German Bight > St Pauli

31
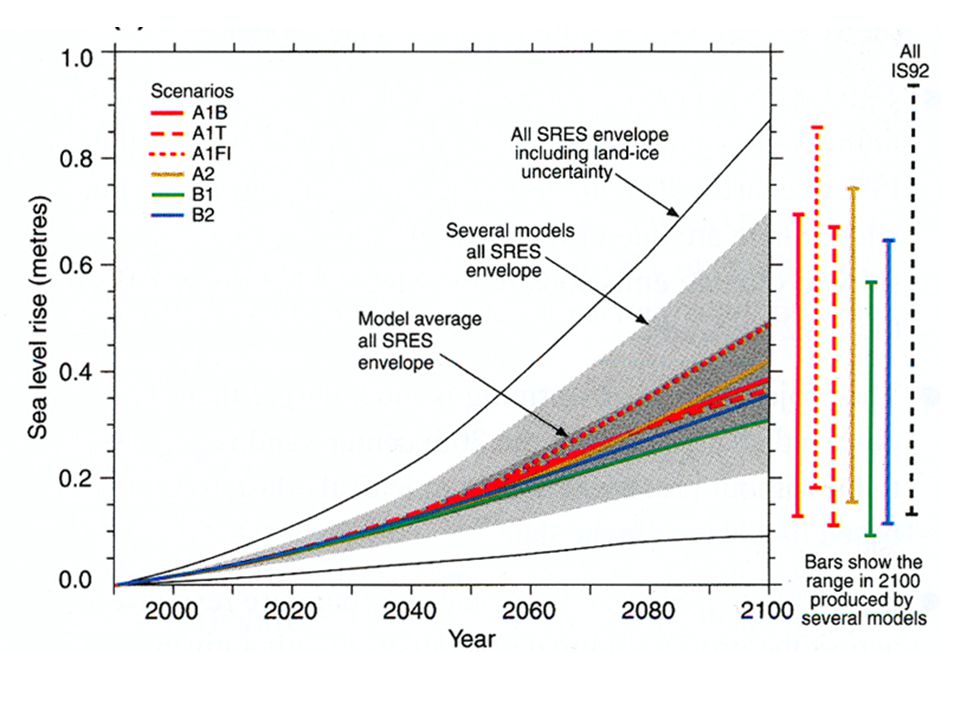
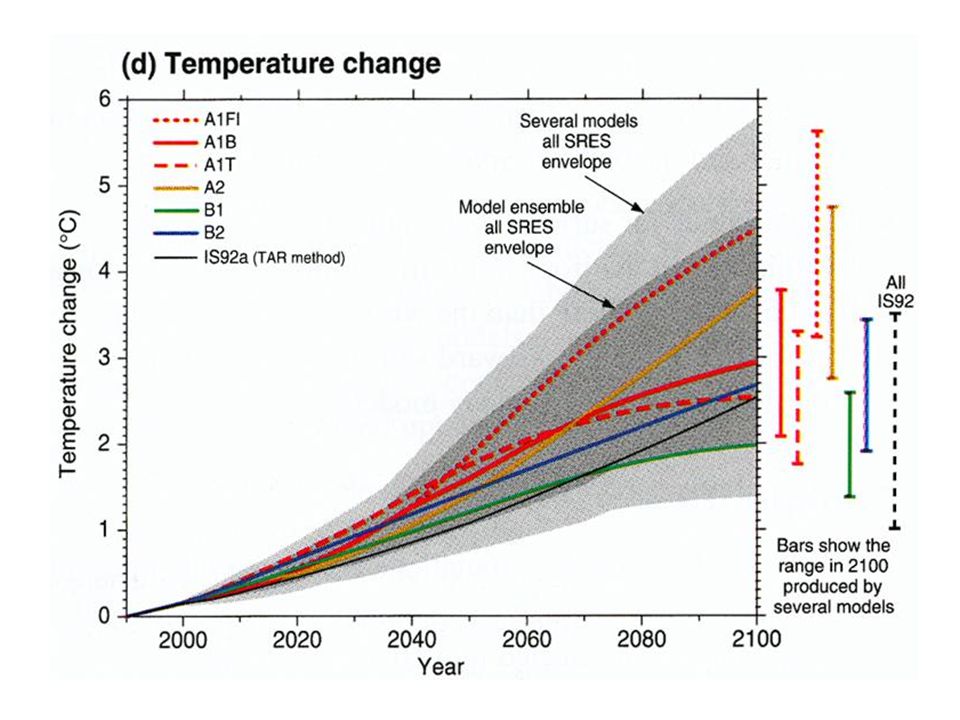
SREs emission scenarios: Impact on global sea level IPCC, 2001 PRUDENCE regional scenario

32
Scenarios 2030, 2085 Nur Effekt von Klimaveränderungen, nicht von Veränderungen der Morphologie der Tideelbe.

33
Flood risk in Hamburg

34
Press release 30 October 2005 30 October 2005 "The Calm before the Storm - Storm surges in the North Sea could become more dangerous from the middle of the century. Scientists from the Institute for Coastal Research of the GKSS Research Centre Geesthacht in Germany have analysed the past history of storms and storm floods in the North Sea region, and used models to investigate future changes. Their result: human-induced climate changes will lead to higher storm surges along the German, Dutch and Danish North Sea coasts but current storm surges are not influenced by human-induced climate change."

36
So far, we had … This was an example of scenarios form the global to the local – which result in unconditional forecasts of elevated future storm surge heights related to elevated concentrations of greenhouse gases in the atmosphere. But is this the complete story for people living in Hamburg and their concern for storm surges?

38
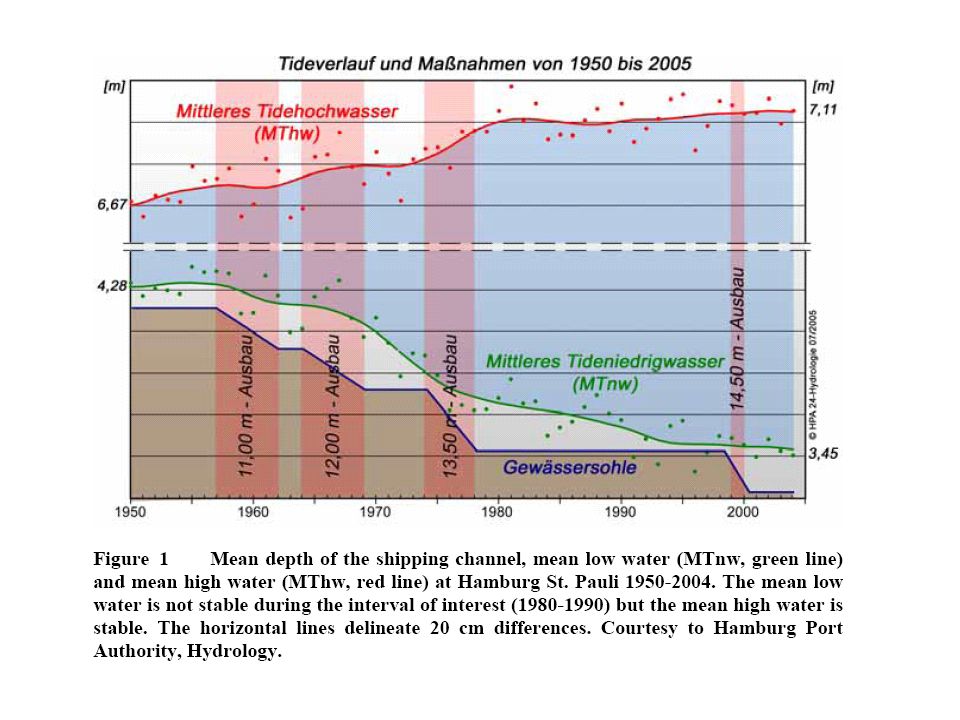
Hamburg – Storm surges Difference St. Pauli - Cuxhaven

39
Hamburg – Storm surges

Similar presentations


 projections Olivier Crespo Thanks to M. Tadross Climate Systems Analysis Group University.>")


