Download presentation
Presentation is loading. Please wait.

1
NPP/C1/C2 Antenna Deployment Schedule (COPC 2009-1.1) and Reducing Product Delivery Latency and COPC 2009-1.2) Jim Vermeulen And Selina Nauman
 and Reducing Product Delivery Latency and COPC ) Jim Vermeulen And Selina Nauman")
2
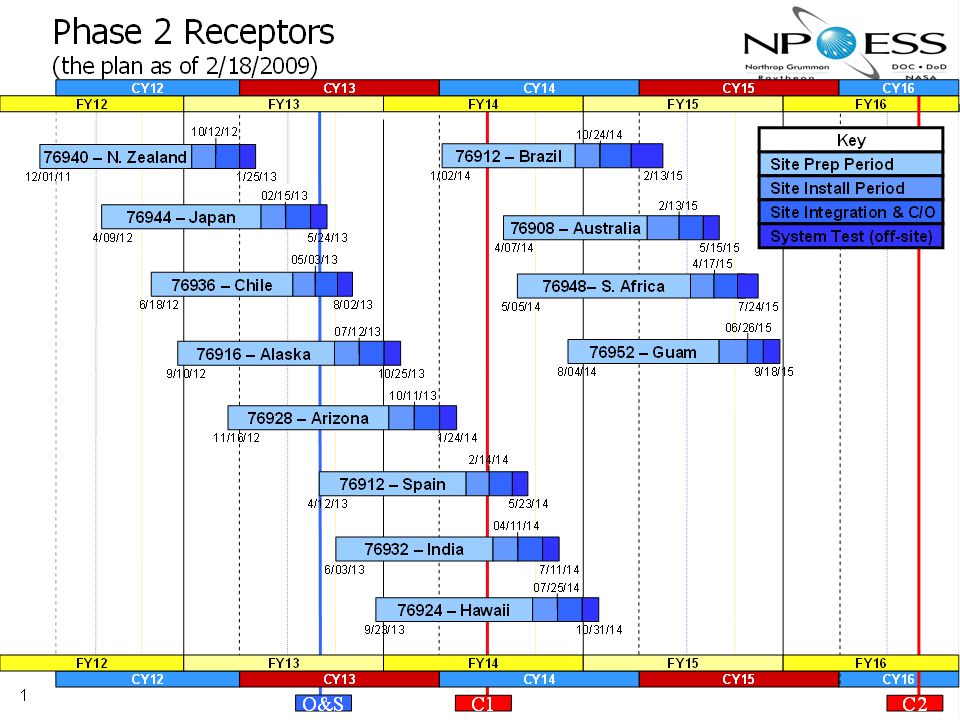
COPC Action Item 2009-1.1 The CSAB will acquire an NPP/C1/C2 antenna deployment schedule and identify the product delivery latency at each major milestone in the schedule.

3
3 System 95% EDR Latency as a Function of Receptor Site Installation Order- August 2009 C2 Launch - 5/16/2016 ► C1 Launch - 3/14/2014 McMurdo, Svalbard and Orlando New Zealand Japan Chile Alaska Arizona Spain India Hawaii Brazil Australia South Africa Guam Performance at C1 Launch Receptors will be brought online after C1 Launch

4
Percent of Products Delivered versus Time Since Observation at C2 launch (5/16/2016) Requirement: 95% of data delivered within 28 min Requirement: 77% of data delivered within 15 min Percent of Data Products Delivered SafetyNetTM architecture defines shape of curve
 Requirement: 95% of data delivered within 28 min Requirement: 77% of data delivered within 15 min Percent of Data Products Delivered SafetyNetTM architecture defines shape of curve")
5
COPC Action Item 2009-1.2 Final reductions in NPOESS product latency will not be realized until C2 implementation (SafteyNet). CSAB will identify technical and/or budgetary issues that could be addressed to influence the schedule to deliver reduced product latency earlier in the schedule. –NESDIS provided the NPOESS CDR RFA #22 response which detailed the deployment/installation of the safety net sites to the COPC CSAB –COPC principles have requested NESIS work with IPO to find out the cost to activate the activate the sites to get to a 38 minutes latency on NPOESS C1 data delivery as soon as possible. –OSDPD setting up meeting with IPO Ground Systems Division Chief September 25, 2009.

7
Back-Up Slides

8
95% Latency Based on Revised Receptor Site Installation Order- April 2008 Longest EDR may be up to 3 minutes later than the aggregate

9
System Data Latency as a Function of Location at C2 launch (5/16/2016) System Data Product Latency, minutes Gaps between receptor sites are a primary driver of System Latency
 System Data Product Latency, minutes Gaps between receptor sites are a primary driver of System Latency")
10
Analysis Methodology for 95% EDR Latency Methodology –Cases run by adding SafetyNet sites in the proposed install order –Multiple DSAT runs executed at each case with weather and station outages DSAT Parameters –Satellites: 1 nominal orbit planes (1330) –Outages: Ao=0.996 (20 hr MTTR, 5000 hr MTBF), single McMurdo receptor –Rain: Worst Month Rain Statistics (ITU model) –Margin: 3 db link margin –Data Rates: Post Nunn-McCurdy, satellite dependent sensor compliment –VIIRS: VIIRS day / night acquisition and compression rates modeled –IDPS: IDPS queuing model. –DMR: Updated DMR processing model

Similar presentations
 Funded by the National Science Foundation/CISE/SCI cooperative agreement no. ANI-0129677.>")


![MWR Algorithms (Wentz): Provide and validate wind, rain and sea ice [TBD] retrieval algorithms for MWR data Between now and launch (April 2011) 1. In-orbit.](/17/5355196/big_thumb.jpg "MWR Algorithms (Wentz): Provide and validate wind, rain and sea ice [TBD] retrieval algorithms for MWR data Between now and launch (April 2011) 1. In-orbit.>")


 Interface Functionality at DoD Centrals Update COPC Action Item 2008-1.7 Jim Vermeulen 13 November 2008.>")


 Update Fall COPC 2007 John Zapotocny CSAB Chair.>")
 824-7331 or Al McMath at.>")


 and the Metop GRAS team (EUMETSAT) 09/09/2011.>")