Download presentation
Presentation is loading. Please wait.

1
Model SLO – Algebra I

2
To Access These Materials After the Training Go to https://pa.drcedirect.comhttps://pa.drcedirect.com Under General Information, select Documents. Under Administration, select 2011-Fall 2014 CDT Training Demo; under Document Type, select Professional Development.

3
Tools to Complete

4
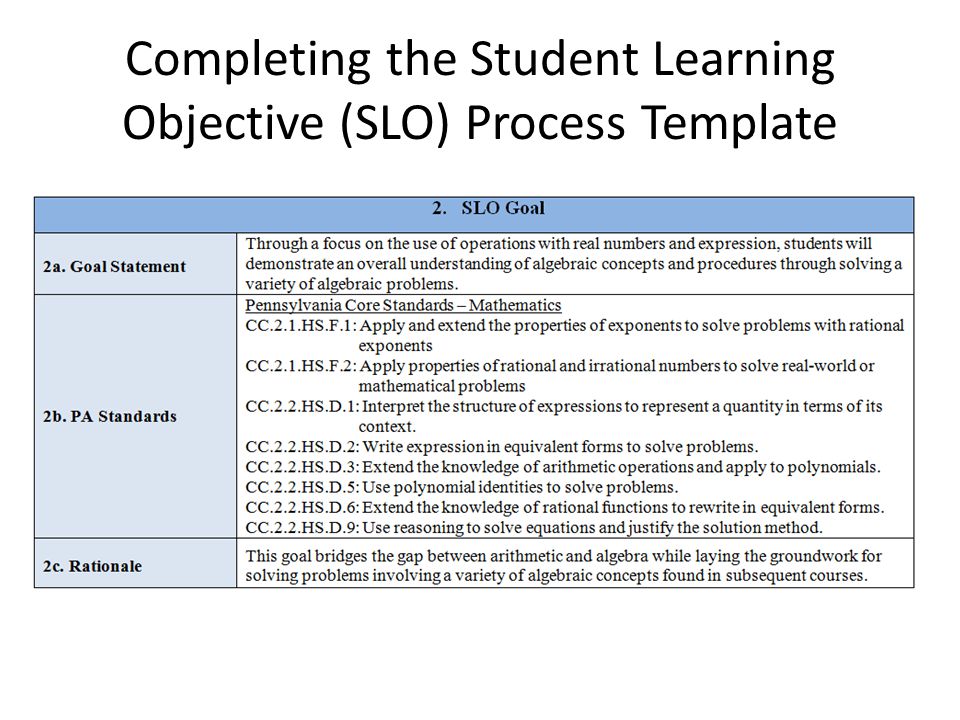
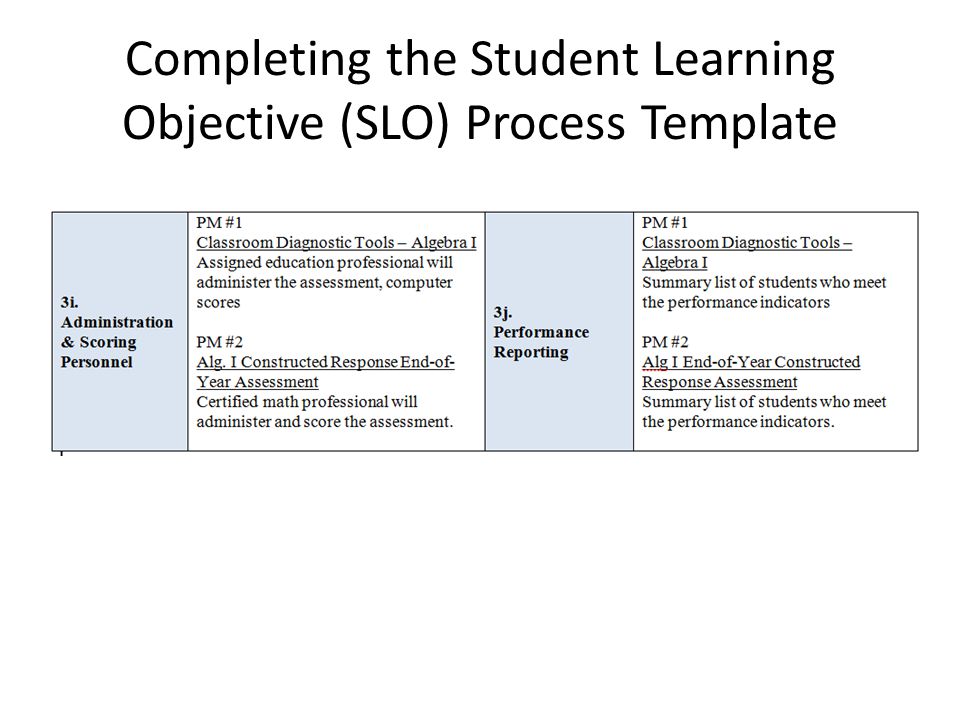
Completing the Student Learning Objective (SLO) Process Template
 Process Template")
11
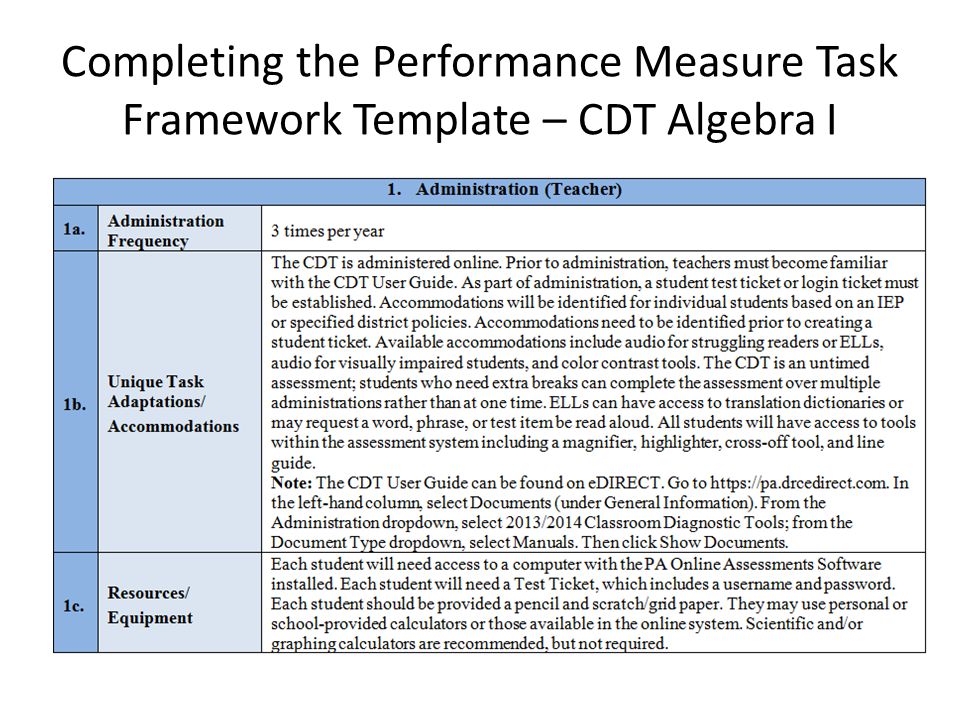
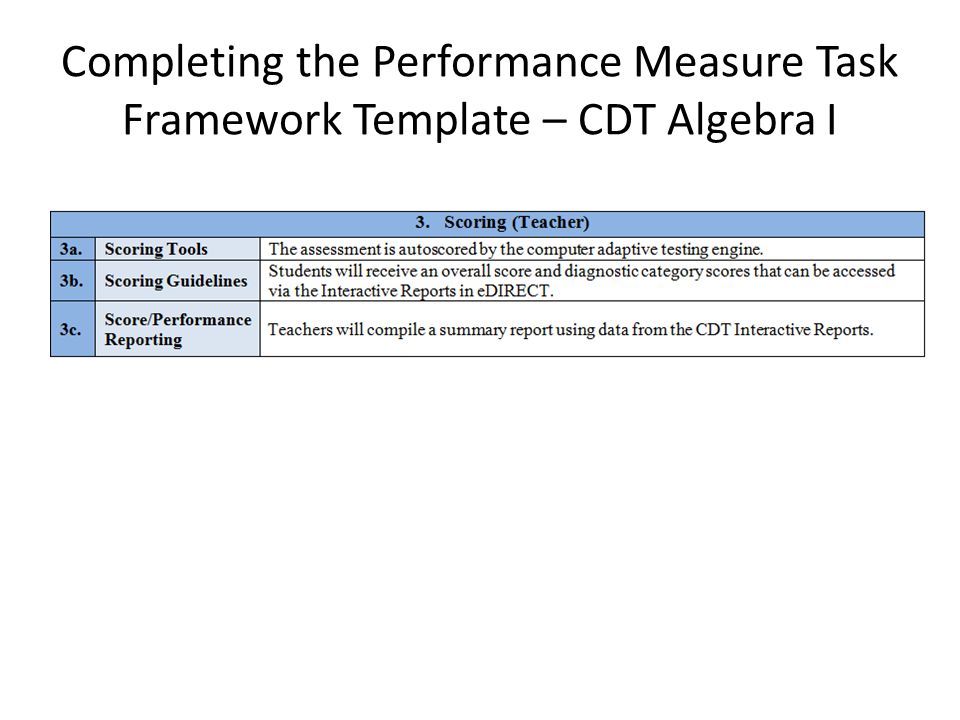
Completing the Performance Measure Task Framework Template – CDT Algebra I

15
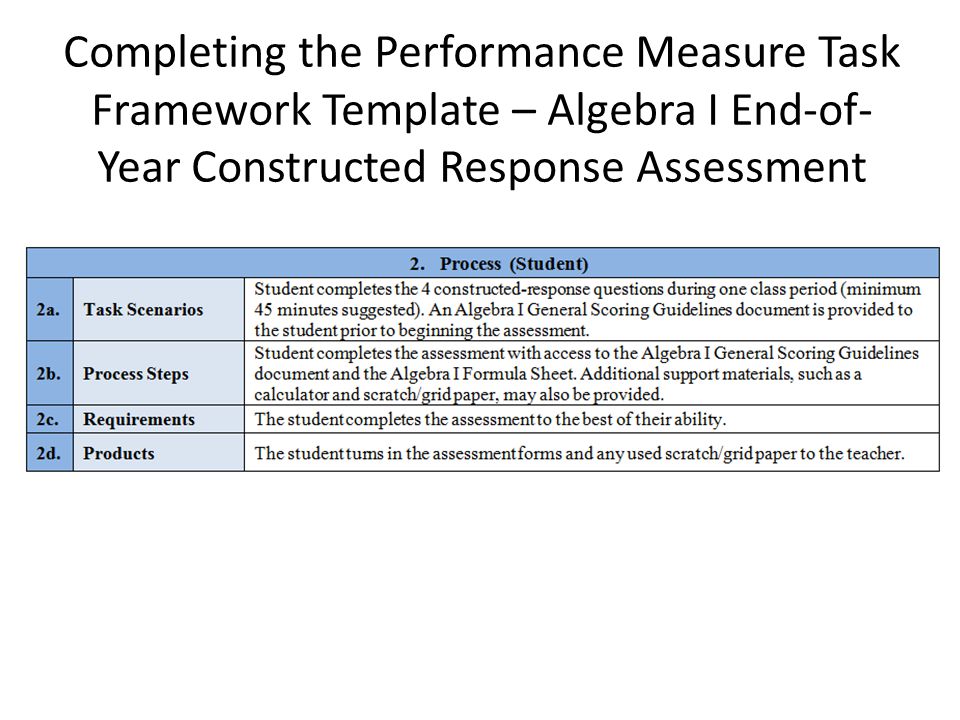
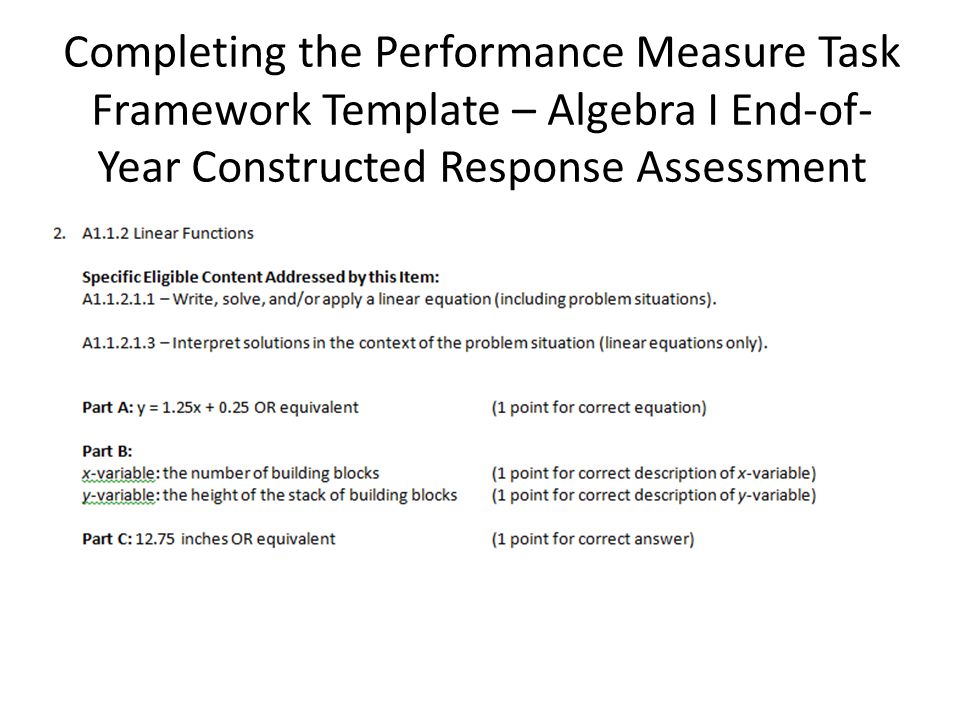
Completing the Performance Measure Task Framework Template – Algebra I End-of- Year Constructed Response Assessment

23
Identifying the Focused Student Group The first administration of the CDT is used to identify which students remain in the All Student Group and which are assigned to the Focused Student Group. If a student’s Overall Score on the first administration of the CDT is 1036 or lower, the student is assigned to the Focused Student Group. This corresponds to the Red band based on the expectations for the end of Grade 8.

24
The 2014-2015 CDT Ranges can be found at: https://pa.drcedirect.com Under General Information, select Documents. Select 2014/2015 Classroom Diagnostic Tools under Administration and Professional Development under Document Type. https://pa.drcedirect.com

25
Logging on to eDIRECT https://pa.drcedirect.com 25DRC Simulation – Algebra I

26
Logging on to eDIRECT Email Address: edeiner@sampleschool.orgedeiner@sampleschool.org Password: SLOdemo13

27
You are now able to use the CDT Reporting Tools and the simulation Select Reporting Tools and then Interactive Reports 27

28
Select Deiner, Emma (122544454) from the Teacher dropdown menu. 28
 from the Teacher dropdown menu. 28")
29
Select SLO Alg 1 from the Student Group dropdown menu. Click the Continue button. 29

30
Change the End Date to 9/30/2013 Select Algebra I from the Map Configuration dropdown menu. 30

31
Group Diagnostic Map – September Administration 31

32
Group Diagnostic Map – September Administration 32

33
Group Diagnostic Map – September Administration 33

34
Group Diagnostic Map – September Administration 34

35
CSV Export from the Group Diagnostic Map 35

36
Change the End Date to 5/7/2014 36

37
CSV Export from the Group Diagnostic Map 37

38
Completing the Student Learning Objective (SLO) Process Template
 Process Template")
39
Students Meeting PI Targets

41
Calculating Elective Rating The first step in calculating elective rating is to determine which students met each performance indicator target. In Excel, you can use a logical test function for each column to determine this for you. For the end-of-course constructed-response assessment, the function is: – (all student group) =IF(CR>=12, “Yes”, “No”) – (focused student group) =IF(CR>=8, “Yes”, “No”) – CR stands for the cell that has the CR score in it, for example, J2 for Sue Kelley.
 =IF(CR>=12, Yes , No ) – (focused student group) =IF(CR>=8, Yes , No ) – CR stands for the cell that has the CR score in it, for example, J2 for Sue Kelley..")
42
Calculating Elective Rating For the Final CDT Score for the All student group, the function is: – =IF(CDT>=1134, “Yes”, “No”) – CDT stands for the cell that has the final CDT score in it, for example, F2 for Sue Kelley. For the Final CDT Score for the Focused student group, the function is: – =IF(GR>=SE, “Yes”, “No”) – GR stands for the cell that has the Growth calculation in it, for example, H40 for Virginia Banks. – SE stands for the cell that has the student’s final standard error in it, for example G40 for Virginia Banks.
 – GR stands for the cell that has the Growth calculation in it, for example, H40 for Virginia Banks. – SE stands for the cell that has the student’s final standard error in it, for example G40 for Virginia Banks..")
43
Calculating Elective Rating Count the number of scores that meet the PI target for each performance measure, and add the totals for each performance measure together. Divide that by the total number of scores. In Excel, you can use a COUNTIF function for each column to determine this for you. The formula is: =COUNTIF(SCSR:ECER,“Yes”) SCSR indicates the first student’s score, e.g., K2 ECER indicates the last student’s score, e.g., K51
 SCSR indicates the first student’s score, e.g., K2 ECER indicates the last student’s score, e.g., K51.")
44
Students Meeting PI Targets

45
Calculating Elective Rating In this student group, 38 students (out of 49) met the performance indicator for the CDT. In this student group, 46 students (out of 49) met the performance indicator for the constructed-response assessment. Elective rating = (38 + 46) / (49 + 49) = 0.8571 My rating, according to section 5a, is Proficient.
 met the performance indicator for the constructed-response assessment. Elective rating = ( ) / ( ) = My rating, according to section 5a, is Proficient..")
46
Ready to Create Your Own SLO? Access the templates to create your own SLO. Go to www.pdesas.orgwww.pdesas.org Then click on Instruction, then Student Learning Objectives. You can then sign in to the Research In Action (RIA) Homeroom site to access the templates and other valuable resources.
 Homeroom site to access the templates and other valuable resources..")
Similar presentations


 Today, we will be presenting an overview.>")


>")


 Essential Questions: 1. How does an SLO factor into teacher evaluation? 2. How will the SLO process be organized at Lower.>")


. All rights reserved.>")
 1 Michele Westphal.>")


