Download presentation
Presentation is loading. Please wait.

1
به نام ايزد يكتا دكتر داودخليلي

2
Cut points of OBESITY Dr. Khalili PhD candidate in epidemiology Shahid beheshti university (MC)
")
3
Some Points About Dichotomizing continuous predictors Simplicity & PracticalityMeasurement error & low Power Trade off Avoid of assumptions Calculate better effect measurements We loss some information Throwing about 1/3 of data away

4
Some Points About Dichotomizing continuous predictors Dichotomizing According to variable distribution Using a gold standard (usually another variable or event ) Dichotomizing: to create two relatively homogenous group 85% or …of percentile
 Dichotomizing: to create two relatively homogenous group 85% or …of percentile")
5
Cut points based on a Gold Standard Receiver Operating Characteristic Curve (ROC) AUC (area Under the Curve)
 AUC (area Under the Curve)")
6
Sensitivity 1 1 - specificity Cut points based on a Gold Standard (ROC) Sensitivity + Specificity -1 Min Max
 Sensitivity + Specificity -1 Min Max")
7
Calculating an effect measure (OR, RR, HR, …) To compare with a reference Agreement Chart Cut points based on a Gold Standard
 To compare with a reference Agreement Chart Cut points based on a Gold Standard")
9
National Health and Nutrition Examination Surveys NHES I1960-6218-79 years NHES II1963-656-11 years NHES III1966-7012-17 years NHANES I1971-751-74 years NHANES II1976-806 mo.-74 years HHANES1982-84 6 mo.-74 years NHANES III1988-942 mo. + NHANES1999-All ages SurveyDatesAges OP96025

10
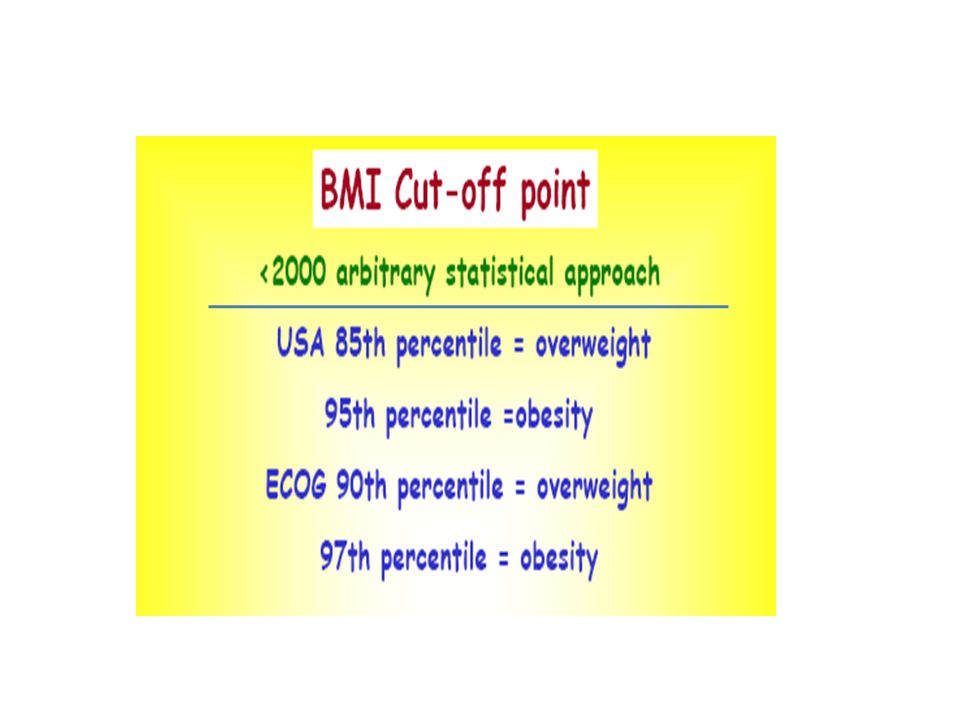
NIH consensus conference (1985): According to NHANES II and 85 th percentile values (men and women ages 20-29 y) BMI of 27.8 for men BMI of 27.3 for women
: According to NHANES II and 85 th percentile values (men and women ages y) BMI of 27.8 for men BMI of 27.3 for women")
11
Probloms of this statistical approach: Distribution Changes Theoretical Curves Need of more information on BMI complication Low sensitivity because of underestimation of Obesity Age-adjusted trends in obesity (BMI >=30): United States
: United States")
13
1995 WHO expert committee report For adults, the Expert Committee proposed classification of BMI with the cut-off points 25, 30 and 40…This classification is based principally on the association between BMI and mortality. BMI cut-points of 25 (overweight) and 30 (obesity) recommended by expert committees
 and 30 (obesity) recommended by expert committees.")
14
Relation between mortality and BMI Data from Lew EA: Mortality and weight: insured lives and the American Cancer Society studies. Ann Intern Med 103:1024-1029, 1985.

15
The method used to establish BMI cut-off points has been largely arbitrary. In essence, it has been based on visual inspection of the relationship between BMI and mortality: the cut-off of 30 is based on the point of flexion of the curve.

16
1998 NHLBI (National Heart, Lung, and Blood Institute )National Heart, Lung, and Blood Institute Clinical Guidelines In this report, overweight is defined as a BMI of 25.0 to 29.9 kg/m2 and obesity as a BMI of 30 kg/m2. The rationale behind these definitions is based on epidemiological data that show increases in mortality with BMIs above 25 kg/m2. The increase in mortality, however, tends to be modest until a BMI of 30 kg/m2 is reached.

17
BMI is in itself a strong predictor of overall mortality both above and below the apparent optimum of about 22·5–25 kg/m2. The progressive excess mortality above this range is due mainly to vascular disease and is probably largely causal. At 30–35 kg/m2, median survival is reduced by 2–4 years; at 40–45 kg/m2, it is reduced by 8–10 years (which is comparable with the effects of smoking). The definite excess mortality below22· 5 kg/m2 is due mainly to smoking-related diseases, and is not fully explained. Recent study in western Europe and North America “Body-mass index and cause-specific mortality in 900 000 adults: collaborative analyses of 57 prospective studies” Lancet. 2009 March 28; 373(9669): 1083–1096.
. The definite excess mortality below22· 5 kg/m2 is due mainly to smoking-related diseases, and is not fully explained. Recent study in western Europe and North America Body-mass index and cause-specific mortality in adults: collaborative analyses of 57 prospective studies Lancet March 28; 373(9669): 1083–")
18
Ischaemic heart disease and stroke mortality versus BMI in the range 15–50 kg/m2 Lancet. 2009 March 28; 373(9669): 1083–1096.
: 1083–")
19
Because of some Reasons: WC instead of BMI

20
WC cut points According to: - Lean MEJ, Han TS, Morrison CE. Waist circumference as a measure for indicating need for weight management. BMJ 1995;311:158–61. Randomly recruited 904 men and 1014 women, aged 25 to 74 years, from the general population of north Glasgow between January and August 1992, excluding only those who were chair bound.

21
BMI as Gold Standard Using in ATPIII & EGIR

22
T S Han, EMvan Leer, J C Seidell, ME J Lean Waist circumference action levels in the identification of cardiovascular risk factors: prevalence study in a random sample. BMJ, 1995;311:1401-5 These cutpoints have been shown, in a random sample of 2183 men and 2698 women from the Netherlands, to be associated crosssectionally with an adverse cardiovascular risk profile.

23
T S Han, EMvan Leer, J C Seidell, ME J Lean 1995;311:1401-5 BMI 25 at action level I or 30 at action level 2 as Gold standard

24
T S Han, EMvan Leer, J C Seidell, ME J Lean 1995;311:1401-5

25
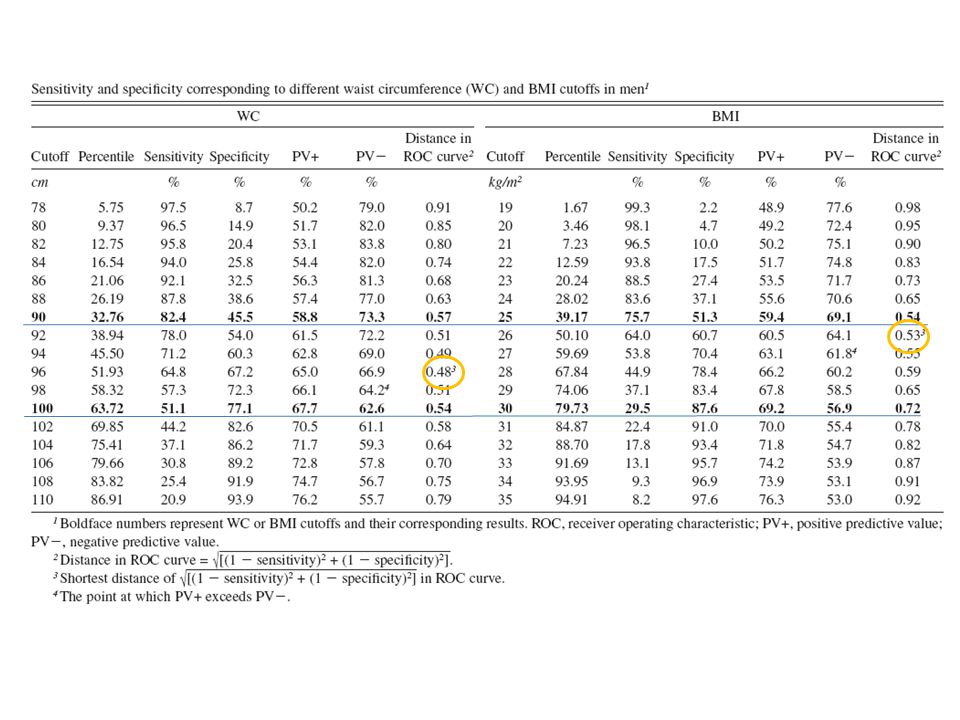
ShanKuan Zhu, Am J Clin Nutr 2002;76:743–9. Current WC cutoffs proposed by the National Institutes of Health and the World Health Organization were not chosen on the basis of their empirical relation to risk factors. Rather, these cutoffs were derived by identifying WC values corresponding to BMI cutoffs for overweight (BMI = 25) or obesity (BMI = 30) (2, 21_). If WC has an independent or a stronger association with risk factors than BMI has, then it is inappropriate to base WC thresholds on their association with BMI thresholds. Rather, thresholds for each should be based on their relation to risk factors. Hence, existing cutoff recommendations may not take full advantage of the relation between WC and obesity-related cardiovascular disease risk factors.
 or obesity (BMI = 30) (2, 21_). If WC has an independent or a stronger association with risk factors than BMI has, then it is inappropriate to base WC thresholds on their association with BMI thresholds. Rather, thresholds for each should be based on their relation to risk factors. Hence, existing cutoff recommendations may not take full advantage of the relation between WC and obesity-related cardiovascular disease risk factors..")
29
WC cutoffs among Chinese adults

30
Country/ethnic-specific values for WC Country/ethnic-specific values for WC A Consensus Statement from the IDF Diabet. Med. 23, 469–480 (2006)
.")
31
Cohort Studies to determine WC cutoff Brazil HTN ----- M: 87 F: 80 2009 Australia CVD mortality 20-69 M: 96 F: 80 2007 Japan CVD ≥ 40 M: 90 F: 80 2009 Thailand CHD 35-59 M: 82 2007 China* CVD risk 18-93 M: 83-88 F: 76 2007 Iran CVD ≥ 40 M: 94.5 F: 94.5 2009 Country Outcome AgeCut offP.Y.

32
Different Gold Standard Different Cut points The more Hard Outcome with lower prevalence The higher Cut point One prevalent CVD rick factor Two prevalent CVD rick factor Three prevalent CVD rick factor Incident CVD CVD mortality

33
هر پايان، شروع ديگری است پس بازهم به نام ايزدمان

Similar presentations


, or Quetelet index, is a measure for human body shape based on an individual's weight and height.>")


 describes relative weight for height: weight (kg)/height (m 2 ) Overweight = 25–29.9 BMI Obesity = >30 BMI.>")


