Download presentation
Presentation is loading. Please wait.

1
AYP Consequences and Erasure Behavior Vincent Primoli Data Recognition Corporation

2
AYP Classifications Made AYP (Made) –met all AYP criteria Level 1 (L1) –did not meet criteria for first time Level 2 (L2) – did not meet >= two years. Internal changes enacted to address problems. Level 3 (L3) –did not meet >= four years. External sources of assistance may be enacted. Making Progress (MP) –met AYP criteria for first year of two-year probationary period
 –did not meet >= four years. External sources of assistance may be enacted. Making Progress (MP) –met AYP criteria for first year of two-year probationary period.")
3
Unit of Analysis - SGS Example Jr. High SGSSchoolYearGradeSubjectErasures/Test AYP Classification 1120106Math0.8Made AYP 2120106 Reading0.6 Made AYP 3120107Math1.1Made AYP 4120107 Reading 0.6Made AYP 5120108Math0.7Made AYP 6120108Reading1.0Made AYP

4
Data Erasure – SGS rates by erasure type (WR, RW, WW) and test type (OP, FT) – SGS outlier scores by erasure type and test type AYP – School-level AYP classifications for previous eight years Performance – SGS Z-scores – performance relative to grade-subject mean Demographic – School-level percent students eligible for free\reduced lunch (ECO %)
 and test type (OP, FT) – SGS outlier scores by erasure type and test type AYP – School-level AYP classifications for previous eight years Performance – SGS Z-scores – performance relative to grade-subject mean Demographic – School-level percent students eligible for free\reduced lunch (ECO %)")
5
Wrong-to-Right Outlier Score (WR OS) P-Value from T-Test OS = │1.086 ln(p/q)│ WR Outlier Score% of SGSs < 10 96.62% >= 10 3.38% >= 20 0.74% >= 30 0.25% >= 40 0.10%
 P-Value from T-Test OS = │1.086 ln(p/q)│ WR Outlier Score% of SGSs < % >= % >= % >= % >= %")
6
Conditional Wrong-to-Right TE = WR + RW + WW CWR = WR / TE

7
Historical AYP Categorization AYP History Percent of SGSs Z-Score WR OSCWR Made AYP42%0.540.80.66 Previous Level 130%-0.372.00.60 Previous Level 214%-0.802.80.57 Previous Level 314%-1.183.60.55

8
Conditional Probabilities AYP History Percent of SGSs OS >= 10OS >= 20OS >= 30OS >= 40 Made AYP42%0.87%0.18%0.06% 0.00% Previous Level 130%2.74%0.43%0.08% 0.01% Previous Level 214%5.14%0.83%0.18% 0.04% Previous Level 314%10.39%3.00%1.24% 0.68% Likelihood Multiple (Compared to reference group - Made AYP) OS >= 10OS >= 20OS >= 30OS >= 40 Previous Level 13.22.41.4 Previous Level 25.94.63.3 Previous Level 312.016.622.3
 OS >= 10OS >= 20OS >= 30OS >= 40 Previous Level Previous Level Previous Level")
9
Percent of Improbable Outlier Scores by Historical AYP AYP History Percent of SGSs OS >= 10OS >= 20OS >= 30OS >= 40 Made AYP42%11%10%9%0% Previous Level 130%24%18%9%3% Previous Level 214%22%16%11%6% Previous Level 314%43%56%71%92%

10
OS vs. CWR by Historical AYP

12
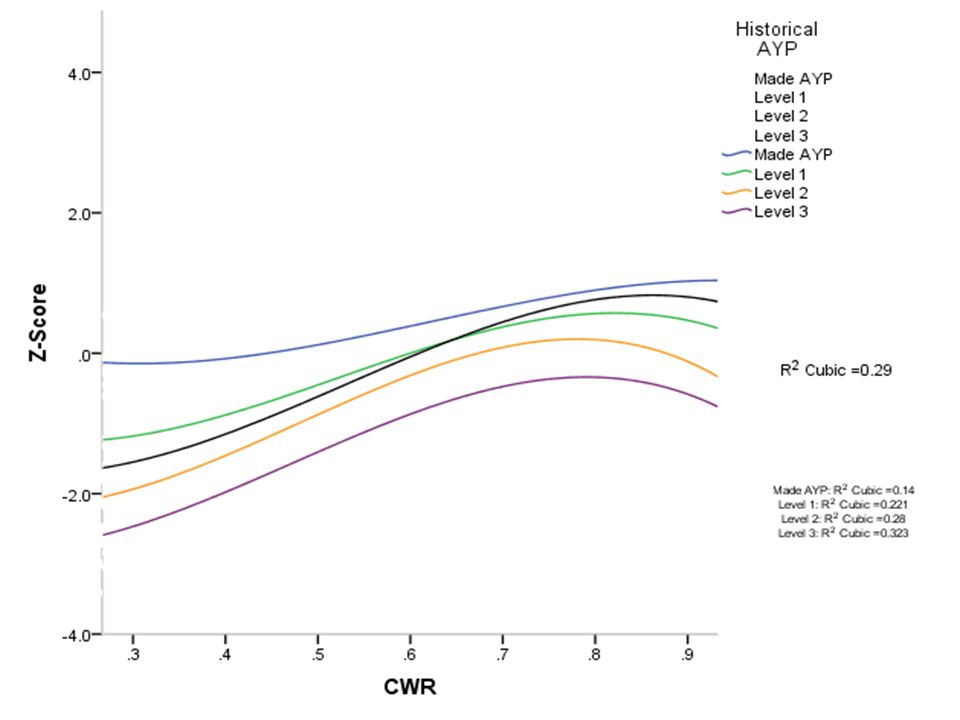
Performance vs. CWR by Historical AYP

14
Two-Year Directional AYP AYP LossesNo ChangeAYP Gains Made-L1Made-MadeMP-Made L1-L2L1-L1L3-MP L2-L3L2-L2L2-MP MP-L2L3-L3L1-Made MP-L3

15
Conditional Probabilities AYP Direction Two-year Categorizations Percent of SGSs OS >= 10OS >= 20OS >= 30 GainMP-Made3.3%10.3%3.5%1.7% GainL3-MP2.0%13.5%2.4%1.2% GainL2-MP2.7%4.3%0.9%0.0% GainL1-Made4.9%6.7%1.7%0.5% No ChangeL3-L34.5%6.3%1.9%0.7% No ChangeL2-L21.3%4.8%0.0% No ChangeL1-L10.4%3.5%2.1%0.0% No ChangeMade-Made66.8%2.0%0.4%0.1% LossMP-L31.6%8.5%2.2%0.4% LossMP-L21.0%2.4%0.0% LossMade-L18.7%4.6%1.0%0.4% LossL1-L21.9%2.9%0.5%0.0% LossL2-L30.8%4.3%0.0% Total100.0%3.4%0.8%0.3%

16
Conclusions Increased likelihood of aberrant rates in probationary schools More failure, more disproportionate More failure, stronger correlation – Erasure proficiency and performance – Erasure proficiency and erasure rate likelihood Directional AYP differences

Similar presentations


>")
 and State and Federal Accountability Elementary and Middle School Principals November 5, 2009.>")


