Download presentation
Presentation is loading. Please wait.

1
Detailed Nifty Analysis 30 June 09

2
Flashback, First. On 6/6/9, we sent a file to over 10000 people via different networks and lists. The file can be still downloaded at www.activetrades.in/downloads/Nifty669.pps www.activetrades.in/downloads/Nifty669.pps On 18/6/9, we sent another file to even more number of people. Link is www.activetrades.in/downloads/Nifty1869.pp s www.activetrades.in/downloads/Nifty1869.pp s

3
Gravity Exists 6354 to 2250 60% index loss But….. 2250 to 4700 in months… 108%+ Return in few months On Sensex in months… Why did we show these facts to you today? Reason is pretty simple – to illustrate the fact that opportunities exist all the time. Which is bigger? 60% fall or 108% rally? Ofcourse 108%! Such is the power of markets. How much did index rally from 13000 to 21000? Just 50%. Compare with current returns. We do not buy sensex. When sensex touched 21000, how did that help you? Did you earn by sensex’s touching of 21000? No. You earned by the movements, and not in POINT BASIS, but PERCENTAGE BASIS. Many investors and even traders “LEFT” the market in the crash, and again coming back. They are truly welcome, but we must understand one thing… that GRAVITY STILL EXISTS

4
Did you earn the direct 100 points on 19/6/9? We boldly explained that how 4200 is a SOLID and only support, and how could Nifty “ATLEAST” bounce from there. Bounced decent 130 points in 30 mins after touching the low of 4202 (SL 4195). We advise you please visit the same again, by simply clicking anywhere. If you remember the animation and wish to skip that, click below. Click Here to skip the 4200 support slideHere
. We advise you please visit the same again, by simply clicking anywhere. If you remember the animation and wish to skip that, click below. Click Here to skip the 4200 support slideHere.")
5
The support 4700 crash Critical Support Area NIFTY SHORT TERM DETAILED CHART 4200 a critical zone. If holds, there is a fair possibility of decent upside. Meaning: If 4200 holds, we may see a pullback to 4450, 4600. If breaks, we may head towards earlier specified levels: 4050, which if breaks Nifty might crash. Advised: To go long on dips near to 4200, stop 10-15 points. PAST. Excerpt from 1869

6
Nifty Long Term Chart Nifty Long Term Chart: As it looks clear from the chart, the long term bullishness of Indian markets is still very much intact. The earlier supports are now resistances. Stiff resistances. See the effect of it As and when R1 broke Nifty went to R2. Meaning 6000 again?? Conclusion from the long term chart basic analysis: 1) The long term bullishness is still intact. 2) The R2 4400 is now broken, though insignificantly, leading way towards R3. 3) The R3 stands at 6000+
 The long term bullishness is still intact. 2) The R is now broken, though insignificantly, leading way towards R3. 3) The R3 stands at")
7
Nifty Med Term Chart Nifty corrected from 6358 to 2202, 4154 points. Note the critical level. Observe… 2202 to 4703 = 2501 = 61.8% of 4154. FIB4 Summarizing the view, there is a critical level at 4700. 2 factors make it critical: a medium term multiple wave reactions, and the critical Fibonacci retracement. Though these levels are static, and that means that they will “never’ break, makes them seem little unrealistic because someday they will break. But looking at the past, these kind of patterns do affect the movement once or twice or even more than twice. Note that in the previous edition, we advised quite boldly that 4700 is a critical level. That level has never been seen again.

8
Nifty Short Term Chart Obs1: Broad Support broken Obs2: H&S Pattern 23.8% 38.2% 68.3% Obs3: Fib1 level 4170 Obs4: Supp became Res Obs5: Poss H&S Summarizing from the short term chart observations: The broader support has been broken once at 4202. Support once broken usually doesn’t holds again. A clear H&S pattern has been spotted which till not has not yet activated, and shall activate if 4200 breaks. The wave amplitude is high, meaning extremely sharp upsides are required to neutralize the effect. The Fibonacci level1 28.3 lies at 4170, the area where we bounced from. The last level of the fib set is at 3361. The support which broke has formed a visible resistance too at the highs. Also a possible local H&S has been seen, which can make things even more bearish. Meaning… If 4200 breaks decisively, we are in for a crack, upto 3950, 3850, 3361.

9
Summarizing: While long term looks bullish for 6000, long periods of consolidations between 6000- 3800 are expected (4 5 years). On medium term, there is a significant resistance at 4700 zone, and Nifty is bullish only above 4500, which it doesn’t needs to cross, but also to sustain. The fact remains that the short term strong support is BROKEN, and to sustain above it, it needs to strengthen the crack. It may strengthen by staying above 4200 and consolidating there. If 4200 breaks decisively, which is expected, we are in for a correction upto 3950-3850, 3360. Like you cannot make building on a broken glass, you cannot lift easily Nifty up on a broken support. Budget is a reallocation act and not necessarily a demand creation step, and hence the economy usually boosts little immediately. Plus, markets have already been 108% up in expectation of good things.

10
Advised: This is a view and not a trade. This is a path. In the movement suggested, there will be lots of pullbacks, cracks and in one movement there can be 100 movements. Trade the movements not the path. Invest in the path and not in the movements. Hence Intraday Buy Sell Trades are reserved and sent only to clients. There is a new scheme we are going to launch… Do you have money, resources but no time to trade? If its yes, then we have something for you…. Call on +919897530054 now.

11
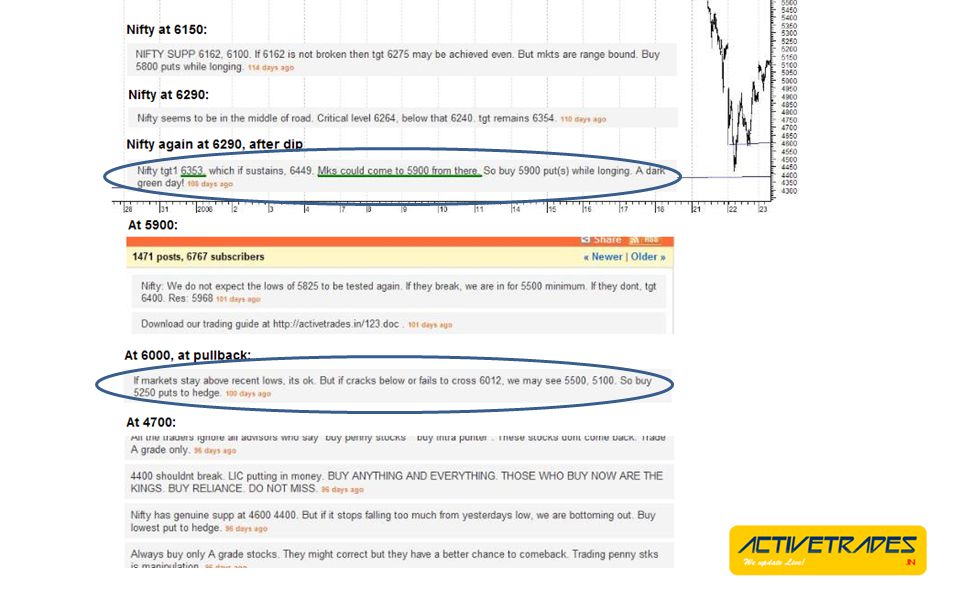
About Us: We “predicted” the kind of movements when nifty was on 2300 2500 band, and when all were bearish for 1800, 1000 whatever, we were bullish. We are not just saying it now, we made full graphic presentations to show that, and published for all. Our readers and subscribers have benefited a lot from it. And the biggest achievement we have is that during the bullish days, we had projected a tgt of 6354, and also said that if it didn’t cross, we are in for 5900-5500-5100-4400. We made a detailed presentation, fwdd to our readers, clients, communities and messengers! Noticably, we bought 5900PE when Nifty was lifetime high, and 5250 (the lowest available put at 5rs premium) and sold at whopping 700! These are the facts, and we do not intend to boast about anything. There are more than 8500 readers, who are also the beneficiary and witness to the same!
 and sold at whopping 700. These are the facts, and we do not intend to boast about anything. There are more than 8500 readers, who are also the beneficiary and witness to the same!.")
12
See how precisely we advised, and we even sketched the forward chart… And see the future movements indicated by grey and red. You can read the complete report at the Nifty View page.

13
The actual chart… It is an old chart. Now Nifty is around 4600+

15
> How to connect to us? There are various services we offer. If you trust the facts, then we can assure you that you WILL benefit. Visit www.activetrades.in/packages to know more.www.activetrades.in/packages You can connect to us by various communities if you are a very occasional trader. It will be our pleasure to serve you for free! You can visit the free Notepad-R and use it as much as you want. There are many more services coming up. So stay tuned. If you have any issues, feel free to email us at ask@activetrades.in.ask@activetrades.in Thank You for staying with us!

Similar presentations
 !. Are you (their problem) ?>")


