Download presentation
Presentation is loading. Please wait.

1
Estimating the distribution of the incubation period of HIV/AIDS Marloes H. Maathuis Joint work with: Piet Groeneboom and Jon A. Wellner

2
Incubation period Time between HIV infection and onset of AIDS 1985 HIV 1996 AIDS Incubation period 11 years

3
1980 HIV AIDS 1985 1996

4
Censored data 1983198619921996 Interval of HIV infection Interval of onset of AIDS Lower bound of incubation period 6 years Upper bound of incubation period 13 years

5
1980 1992 1996 198019831986 X (HIV) Y (AIDS) Interval of onset of AIDS Interval of HIV infection
 Y (AIDS) Interval of onset of AIDS Interval of HIV infection")
6
1980 X (HIV) Y (AIDS)
 Y (AIDS)")
7
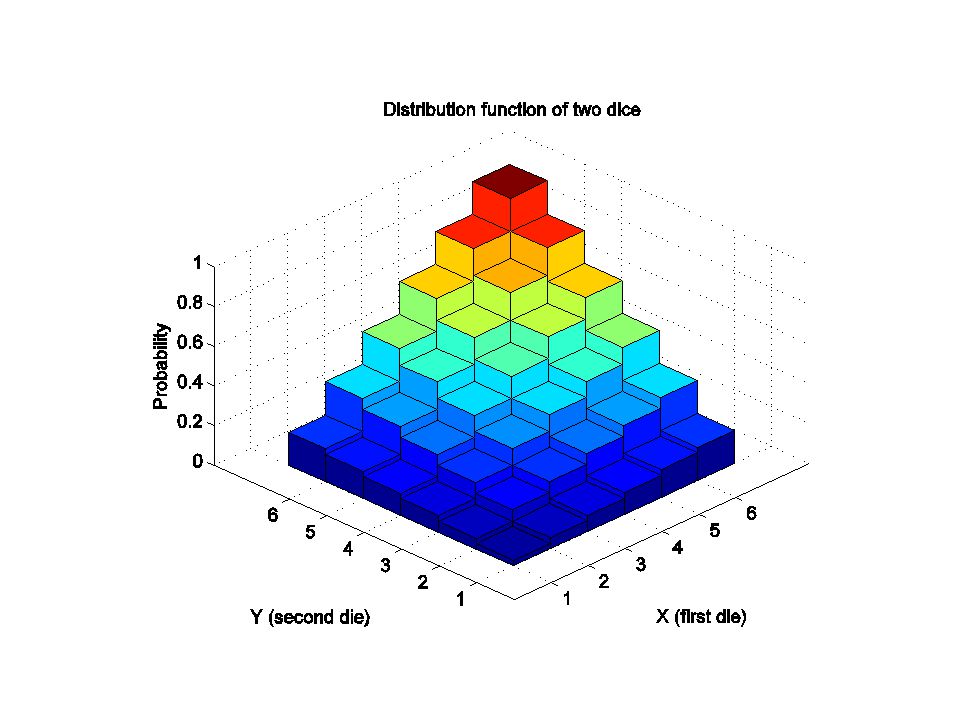
Distribution functions Goal: estimate the distribution function of the incubation period of HIV/AIDS Why? This is important for predicting the future course of the epidemic Strategy: First estimate the 2-dimensional distribution

10
Main focus Nonparametric maximum likelihood estimator (MLE) for 2-dimensional distribution: –Computational aspects –Theoretical properties (consistency)
 for 2-dimensional distribution: –Computational aspects –Theoretical properties (consistency)")
11
Computation of the MLE Parameter reduction: determine the inner rectangles Optimization: determine the amounts of mass assigned to the inner rectangles.

12
max Inner rectangles X (HIV) Y (AIDS)
 Y (AIDS)")
13
max Inner rectangles X (HIV) Y (AIDS)
 Y (AIDS)")
14
max Inner rectangles X (HIV) Y (AIDS)
 Y (AIDS)")
15
max Inner rectangles X (HIV) Y (AIDS)
 Y (AIDS)")
16
max Inner rectangles X (HIV) Y (AIDS)
 Y (AIDS)")
17
max Inner rectangles The MLE is insensitive to the distribution of mass within the inner rectangles. This gives non-uniqueness. X (HIV) Y (AIDS)
 Y (AIDS).")
18
α1α1 α2α2 α3α3 α4α4 X (HIV) Y (AIDS)
 Y (AIDS)")
19
α1α1 α2α2 α3α3 α4α4 X (HIV) Y (AIDS)
 Y (AIDS)")
20
α1α1 α2α2 α3α3 α4α4 X (HIV) Y (AIDS)
 Y (AIDS)")
21
α1α1 α2α2 α3α3 α4α4 X (HIV) Y (AIDS)
 Y (AIDS)")
22
α1α1 α2α2 α3α3 α4α4 X (HIV) Y (AIDS)
 Y (AIDS)")
23
s.t.and α1α1 α2α2 α3α3 α4α4 X (HIV) Y (AIDS)
 Y (AIDS)")
24
s.t.and 3/5 0 0 2 5 The α i ’s are not always uniquely determined: second type of non-uniqueness X (HIV) Y (AIDS)
 Y (AIDS)")
25
Graph theory R4 R1 R2 R3 R5 R3R4 R2R5 R1 Intersection graph The maximal cliques correspond to the inner rectangles Maximal cliques: {R1,R2,R3}, {R3,R4}, {R4,R5}, {R2,R5} Set of rectangles

26
Existing reduction algorithms Betensky and Finkelstein (1999) Gentleman and Vandal (2001,2002) Song (2001) These algorithms are slow, complexity O(n 4 ) to O(n 5 )
 Gentleman and Vandal (2001,2002) Song (2001) These algorithms are slow, complexity O(n 4 ) to O(n 5 )")
27
New algorithms MaxCliqueFinder complexity ≤ O(n 2 log n) SimpleCliqueFinder complexity O(n 2 )
 SimpleCliqueFinder complexity O(n 2 )")
28
160123456789101112131415 0198765432 0 1 4 6 8 2 5 7 9 3 0 R4 R1 R2 R3 R5 Segment tree

29
160123456789101112131415 0198765432 0 1 4 6 8 2 5 7 9 3 0 R4 R1 R2 R3 R5 Segment tree

30
160123456789101112131415 0198765432 0 1 4 6 8 2 5 7 9 3 0 R4 R1 R2 R3 R5 Segment tree

31
160123456789101112131415 0198765432 0 1 4 6 8 2 5 7 9 3 0 R4 R1 R2 R3 R5 Segment tree

32
{R5,R2} {R3,R1,R2} Maximal cliques: 160123456789101112131415 0198765432 0 1 4 6 8 2 5 7 9 3 0 R4 R1 R2 R3 R5

33
1 1 1 1 0 0 0 0 1 1 3 3 2 1 1 0 0 2 1 3 3 2 1 2 1 0 2 1 2 2 1 0 1 1 0 1 0 1 1 0 0 1 1 0 0 0 2 1 1 1 2 2 1 0 0 1 1 0 0 1 1 0 0 0 0 0 0 0 1 1 0 0 SimpleCliqueFinder 1 2 2 2 1 1 0 0 2

35
Computation of the MLE Parameter reduction: determine the inner rectangles Optimization: determine the amounts of mass assigned to the inner rectangles.

36
Optimization High-dimensional convex constrained optimization problem

37
Amsterdam Cohort Study among injecting drug users Open cohort study Data available from 1985 to 1997 637 individuals were enrolled 216 individuals tested positive for HIV during the study

38
Model X:time of HIV infection Y: time of onset of AIDS Z = Y-X: incubation period U 1,U 2 : observation times for X C: censoring variable for Y (X, Y) and (U 1,U 2, C) are independent
 and (U 1,U 2, C) are independent")
39
HIV AIDS u1u1 u2u2

40
HIV AIDS u1u1 u2u2

41
HIV AIDS u1u1 u2u2

42
HIV AIDS t = min(c,y) u1u1 u2u2
 u1u1 u2u2")
43
HIV AIDS t = min(c,y) u1u1 u2u2
 u1u1 u2u2")
44
HIV AIDS t = min(c,y) u1u1 u2u2
 u1u1 u2u2")
45
HIV AIDS u1u1 u2u2 We observe: W = (U 1, U 2, T=min(C,Y), Δ)
, Δ)")
46
HIV AIDS u1u1 u2u2 t = min(c,y) We observe: W = (U 1, U 2, T=min(C,Y), Δ)
 We observe: W = (U 1, U 2, T=min(C,Y), Δ)")
47
HIV AIDS u1u1 u2u2 t = min(c,y) We observe: W = (U 1, U 2, T=min(C,Y), Δ)
 We observe: W = (U 1, U 2, T=min(C,Y), Δ)")
48
HIV AIDS u1u1 u2u2 t = min(c,y) We observe: W = (U 1, U 2, T=min(C,Y), Δ)
 We observe: W = (U 1, U 2, T=min(C,Y), Δ)")
49
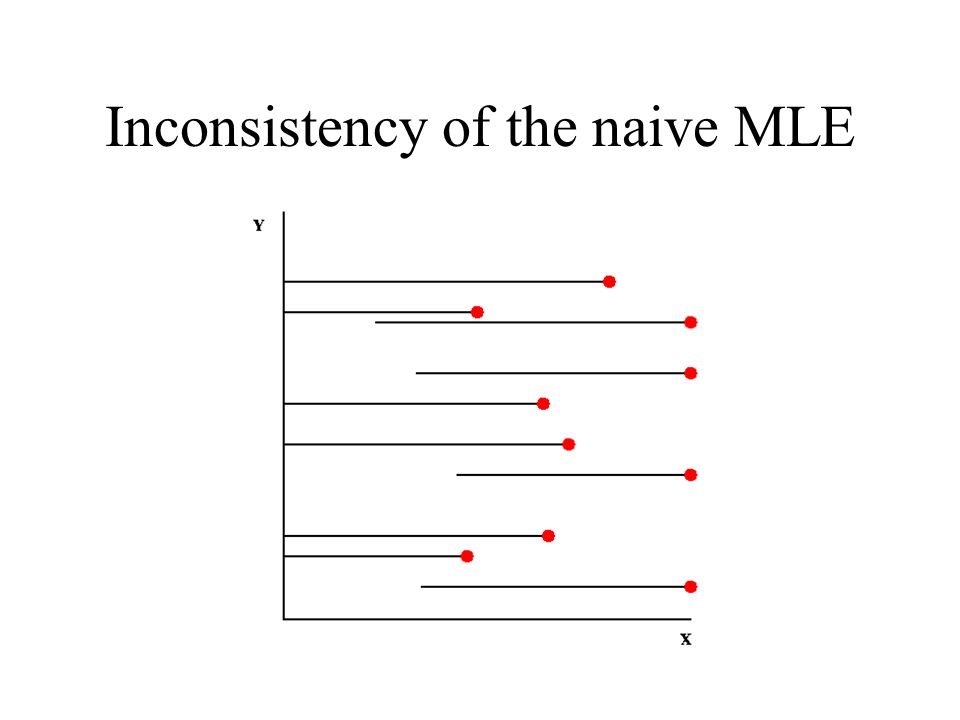
Inconsistency of the naive MLE

53
Methods to repair inconsistency Transform the lines into strips MLE on a sieve of piecewise constant densities Kullback-Leibler approach

54
1985 1980 X (HIV) Y (AIDS) How to estimate P(Y-X ≤ z)?
 Y (AIDS) How to estimate P(Y-X ≤ z)")
61
The distribution function of the incubation period cannot be estimated consistently P(Z ≤ z, Y ≤ 1997) What we can estimate consistently is
 What we can estimate consistently is")
63
Conclusions (1) We found the graph theoretic framework very useful Our algorithms for the parameter reduction step are significantly faster than other methods. We proved that in general the naive MLE is an inconsistent estimator for our AIDS model.

64
Conclusions (2) We explored several methods to repair the inconsistency The MLE can be very sensitive to small changes in the data There is not enough information to estimate the incubation period consistently without making additional assumptions
 We explored several methods to repair the inconsistency The MLE can be very sensitive to small changes in the data There is not enough information to estimate the incubation period consistently without making additional assumptions")
Similar presentations


 for bivariate censored data Marloes H. Maathuis advisors: Piet Groeneboom and Jon A. Wellner.>")


