Download presentation
Presentation is loading. Please wait.

1
How are we doing? Sort the types of error into sampling and non-sampling errors, then match the situations to the types of error.

2
Understanding sampling error and non-sampling error Choosing the correct rule of thumb for margin of error Knowing what to do when proportion is 70% Deciding whether a study is an experiment or an observation Understanding sampling methods Polls and surveys What else?

3
Understanding sampling error and non- sampling error

5
ESA Study guide Level 3 Statistics (and ESA L3 Statistics Learning Workbook) “ Non-sampling errors result from how information is collected from a sample… Examples are: Non-participation False answers Unavailability Lack of opinion…” No mention of major sources of non-sampling error such as incorrect sampling frame, biased sampling method, survey method, etc. LACK OF CLARITY

6
NO INFORMATION?

7
AME Level 3 Statistics Workbook (revised for 2014) Nulake LACK OF CLARITY
 Nulake LACK OF CLARITY")
8
… but that leaves us with textbooks and exercise books with either no information or unclear information. Where to from here?

9
Sampling error arises due to the variability that occurs by chance because a random sample, rather than an entire population, is surveyed. Non-sampling error is all error that is not sampling error.

10
Unclear or leading questions Sampling frame which doesn’t match target population Biased sampling method Interviewer effects Survey format effects Wrong analysis methods Behavioural issues Coding errors Misinterpretation of analysis Transfer of findings Non-response Hidden agenda

11
Choosing the correct rule of thumb for margin of error

13
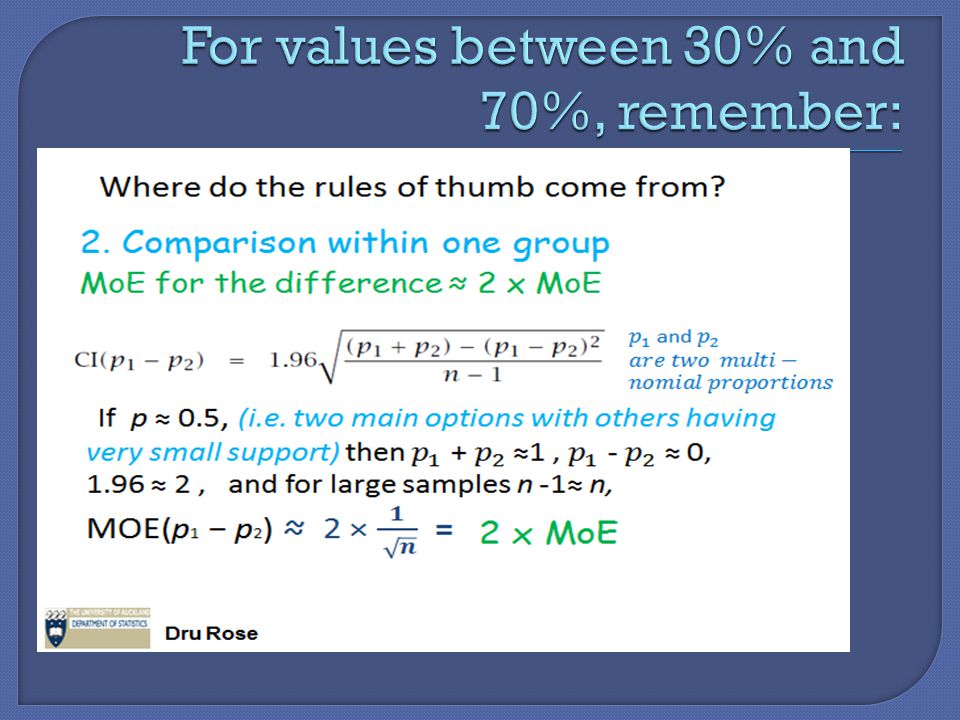
“If the results are within the same survey or poll, then Margin of Error of Difference = 2×Margin of Error of the Poll” “Dependent Probabilities … two events from within the same question then these two probabilities are dependent on each other. Independent Probabilities If we have two polls or two independent questions in the same survey that are independent of each other… … MOE = 1.5(average MOE).” Questions can be asked of different groups within the same survey or poll, so difference is not always 2×MOE The definition of dependent probabilities makes it seem as though comparing different questions for the same group would be independent. LACK OF CLARITY?
. Questions can be asked of different groups within the same survey or poll, so difference is not always 2×MOE The definition of dependent probabilities makes it seem as though comparing different questions for the same group would be independent. LACK OF CLARITY .")
15
ESA Study Guide Level 3 Statistics ESA Study Guide Level 3 Learning Workbook Sigma (not in the book at all) AME Level 3 Statistics Workbook D&D Practice External Assessments others? LACK OF CLARITY?

16
Focus on one group or two groups One group, one answer One group, difference Two groups, difference Improve our resources

19
…comparing answers to the same question (eg National or Labour) for one group is different from comparing the answers to two different questions for one group.
 for one group is different from comparing the answers to two different questions for one group.")
25
It is enough for students to know that there are formulas that simplify to the rules of thumb for percentages between 30% and 70%. Students should not be memorising complicated formulas to use below 30% or over 70%. Students should not be memorising one full formula and substituting it into the other rules of thumb.

26
Knowing what to do when proportion is 70%

27
Explain why it would be inappropriate to use the reported margin of error to construct a confidence interval for the percentage of respondents from the November 2009 survey who never talk to their friends on a landline. (the reported percentage was 9%)
.")
28
Confidence interval using the rule of thumb Interpret CI: With at least 95% confidence, we can infer that the percentage of adult New Zealanders with health insurance who will have had their blood pressure checked during the previous 12 months is somewhere between 87.4% and 92.6%.

29
that they can be more confident that the true population proportion (or percentage point difference) is within the rule of thumb based interval if the proportion(s) is/are below 30% or over 70%. “At least 95% confidence” conveys this understanding. the actual level of confidence for the rule of thumb confidence interval is higher than 95%. the true 95% confidence interval would be narrower than the rule of thumb confidence interval. “margin of error” describes half of a 95% CI so we can’t call the result of our rule of thumb calculation a MOE unless 0.3<p<0.7.

30
1. Match the context to the correct rule of thumb. 2. Calculate the confidence interval. 3. Match your confidence interval to the correct confidence interval (harder than you think!) 4. Match your context and interval to the correct interpretation.
 4. Match your context and interval to the correct interpretation..")
31
Deciding whether a study is an experiment or an observation

32
The word “experiment” is often used loosely to mean an observational study. A true experiment must have an intervention. The experimenter must change something.

33
The intervention can be very small. An experiment where the groups are not randomly allocated is still an experiment, just not a well-designed one.

35
In the real world, sampling is often very complex Students should be familiar with random sampling (simple, systematic, stratified, cluster) Students should be aware of non- probability methods (convenience, quota)
 Students should be aware of non- probability methods (convenience, quota)")
36
Weighting is used with stratified sampling.

37
Pasifika make up 7% of NZ population so in a random sample of 1000, we would expect only 70 Pasifika people. By taking an extra sample of 200 more Pasifika we reduce the MOE for comparisons involving Pasifika. When using our data for all the NZ population we weight the 270 Pasifika as if they were only 70 people (multiply by 70/270), so that they are represented in proportion to the population.
, so that they are represented in proportion to the population..")
38
Surveys tend to get more nonresponse from men than women, so weighting is used to get a picture of the population in proportion. If we take a sample of 1000 people and get 400 men and 600 women, we weight the men’s responses (×0.5/0.4) and the women’s (×0.5/0.6), so that they are in proportion for the population. We only weight when combining to get a picture of the whole population.
 and the women’s (×0.5/0.6), so that they are in proportion for the population. We only weight when combining to get a picture of the whole population..")
40
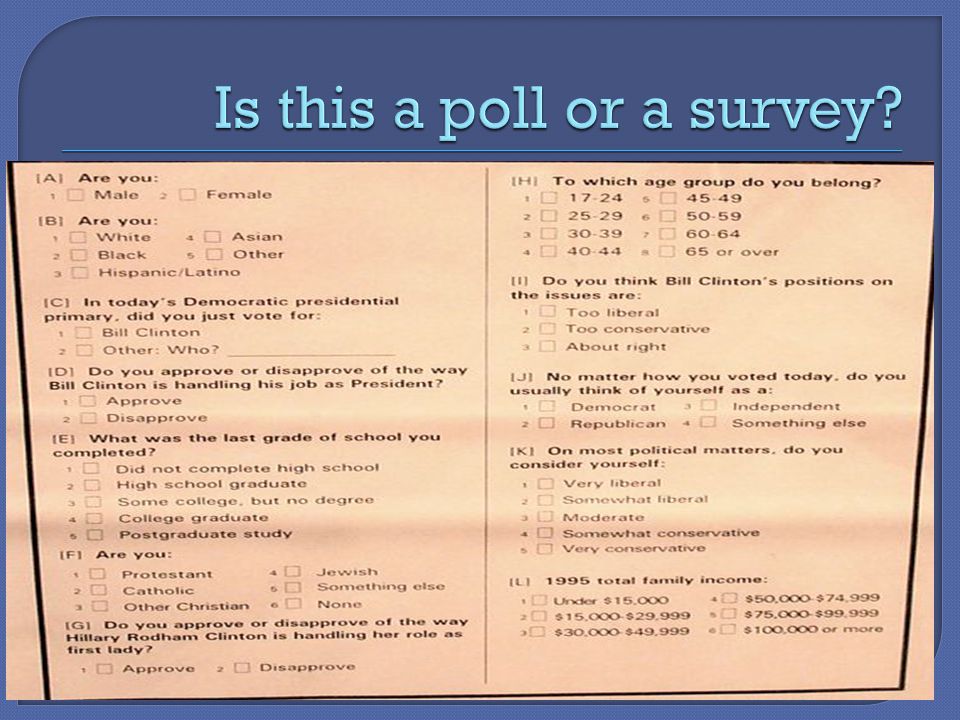
A poll is a type of survey. All polls are surveys but not all surveys are polls. pollsurvey Few questions (how many is few?) May have many questions Multi-choice questions May ask open questions
 May have many questions Multi-choice questions May ask open questions.")
Similar presentations